Friday, August 05, 2011

University Management

By: Gary J. Salton, Ph.D.
Chief: Research & Development
Professional Communications, Inc.


ABSTRACT
The information processing structure of universities is studied though a sample of 732 positions at over 100 different universities. Statistics reveal that there are structural disjoints that will result in persistent systematic issues. These structural “disjoints” need not be corrected. They are necessary for the effective functioning of the university,
A self-imposed standard of confining research blogs to about 2000 words requires omitting some useful elaborations. A complementary video which both expands on and abbreviates this research blog is available by clicking the icon to the right.


THE UNIVERSITY
The university has two goals. The inter-generational transfer of knowledge preserves the knowledge gains of past generations. The creation of new knowledge objective is focused on the legacy to be left to the future.

Professors control knowledge content. Surrounding them is a management structure that controls the circumstances through which the content is delivered. Effective functioning requires that the information processing strategies of these elements —their “I Opt” strategic styles and patterns—be aligned.

Each management component serves a different function its strategy must be aligned to fulfill this mission. That strategy must likewise “fit” with the mission of other organizational elements. How well these strategies mesh will determine university success.

University management is arranged in organizational layers. For purposes of this study these units are grouped. Directors are non-academic executives that head functions or programs. Administrators include managers and other supervisory staffs that guide the operations of the functions or programs.The staff consists of professionals and other support personnel who actually execute the needed functions. Table 1 outlines the sample based on these groupings. The size and diversity appears sufficient for it to be considered representative.

Table 1
UNIVERSITY SAMPLE CHARACTERISTICS


THE PROFESSORS
The Professor staff has been analyzed in a separate research blog ("The Professors"). There is no statistically significant difference based on academic rank. Therefore the “I Opt” profiles of all 254 Professors can be consolidated and their averages are shown in Graphic 1

Graphic 1
UNIVERSITY PROFESSOR PROFILE
(n = 254)


The combination of a very high idea-generating RI style (31.5% on Graphic 1) and a secondary analytical HA approach (25.6% on Graphic 1) describes a “Perfector” pattern. In colloquial terms the "Perfector" pattern of behavior can be described as “Great idea!! Let’s think it through completely.” This is not a formula for decisive management but does serve the Professor’s instrumental role of knowledge creation and transfer within a university structure.

THE DIRECTORS
A total of 140 Directors drawn from 69 universities were used in the sample. This category includes Deans whose position do not have academic content. Table 2 outlines the range of functions of Directors included in this study. Overall they appear to fairly represent the range of activities needed to support the university mission.
Table 2
DIRECTOR FUNCTIONS REPRESENTED IN THE STUDY


Directors set policy, practice and procedure. In doing this they extract information from the environment, process it using their own standards and issue output aligned with their responsibilities. Graphic 2 shows how well their profile—and thus their interpretation of decision issues—matches that of the Professors.
Graphic 2
PROFESSOR vs. DIRECTOR “I OPT” PROFILES


Overall, the Directors and Professors are “cut from the same cloth.” The single significant difference is in the decisive action Reactive Stimulator style. Directors are inclined toward acting more responsively than are their Professor counterparts. Graph 3 shows the clear shift in this style preference.

Graphic 3
PROFESSOR vs. DIRECTOR
REACTIVE STIMULATOR PROFILE


THE ADMINISTRATORS
This category of management consists of managers, assistant Directors, associate deans (non-academic) and similar titles sourced from 55 universities. The role of this level of management is in guiding relatively near-term operations in various functional areas. Table 3 identifies some of the areas of responsibility. It appears reasonably representative of the range functions typically involved in university operations.
Table 3
ADMINISTRATOR FUNCTIONS REPRESENTED IN THE STUDY


Administrators are likely to periodically interact with both Professors and Directors on decision matters. The degree to which their information processing profiles match will influence the level of managerial harmony. Matching profiles indicate people are “talking the same language.” Divergent profiles mean that the parties are paying attention to different aspects of an issue, weighting them differently and seeking a different resolution. Table 4 shows the statistical significance of the difference for each strategic style.

Table 4
STATISTICAL SIGNIFICANCE OF STYLE DIFFERENCES
Probability that observed differences are due to chance alone


Professors vs. Administrators:
The academic standard for statistical significance is 5% or less. Table 4 (above) shows that Administrators differ form both Professors and Directors but in different ways. Administrators fall short of the Professors idea-generating RI tendencies. In general Professors are likely to view Administrators as a bit shortsighted and unimaginative. Administrators are likely to see Professors as a tad “blue sky” in orientation and somewhat out of touch with the real world. The degree of difference probably nets out to more of an annoyance than a basis of hostility. Graphic 4 (below) gives a picture of the Professor-Administrator differences across the range of strengths which the RI style is held..


Graphic 4
PROFESSORS vs. ADMINISTRATORS
RELATIONAL INNOVATOR PROFILES


Directors vs. Administrators:
Administrator and Director differences center on the analytical HA style. Graphic 5 shows that it is localized to a particular group of Administrators (see blue arrow).

Graphic 5
DIRECTORS vs. ADMINISTRATORS
HYPOTHETICAL ANALYZER PROFILES


Directors are likely to view most Administrators as roughly in line with their view of issues. But one small Administrator group (blue arrow in Graphic 5) will probably be seen as spending too much time, energy and probably money on analysis, assessment and evaluation. For their part, this Administrator subset is likely to view the Directors as a bit superficial.

Overall, Directors and Administrators are reasonably well matched. The information processing disjoint is local and focused on a small percentage of Administrators (i.e., 17%). Overall, Directors and Administrators may not come to exactly the same conclusion on particular issues. However, they are likely to see the same variables as important, process them in roughly the same way and more or less agree on the degree of analysis appropriate to an issue.


THE STAFFS
The staff is technically not part of management. However, their roles affect the information available to and decisions made by management. In addition the ability of the staff to execute the directives given by management fundamentally influences the functioning of the university system. Non-management staffs matter.

Table 5 specifies some of the roles performed by the 203 staff members from 59 universities included in the sample. It appears to be sufficiently broad as to be representative of the universities non-managerial staffs.

Table 5
NON-MANAGEMENT FUNCTIONS REPRESENTED IN THE STUDY

Table 6 (below) shows 12 “I Opt” relationships between the staff versus Professors, Directors and Administrators. Eight of the 12 meet the 5% or less standard of academic significance. In other words most staff members will tend to “see” issues in fundamentally different terms than do the various levels of management.
Table 6
NON-MANAGEMENT STATISTICAL SIGNIFICANCE TESTS
VERSUS OTHER MANAGEMENT LEVELS
Probability that observed differences are due to chance alone


Table 7 (below) shows 12 relationships between the various management levels without staffs considered. Only 3 or 25% (3/12=.25) of the relationships register a statistically significant difference. Management is a relatively homogeneous group. What this means is that the university’s challenge is integrating the staffs into the management structure in a way that people can “understand” each other. Left unattended this can lead to misinterpretation, misdirected outcomes and emotional stress for all involved.

Table 7
MANAGEMENT LEVEL STATISTICAL SIGNIFICANCE TESTS
Probability that observed differences are due to chance alone

The university structure directly addresses this potential issue in a traditional manner. The interaction of management and non-management staffs is mediated. Administrators and non-management have a marginally significant disjoint on only two levels strategic style levels (i.e., the LP and RI on Table 6). Effectively, Administrators act as a “bridge” between the Staffs and the various levels of management.

The idea-generating RI is one of the points of difference between Administrators and Staff. Graphic 6 shows that the difference divides neatly.

Graphic 6
ADMINISTRATORS vs. STAFF
RELATIONAL INNOVATOR PROFILES

The red arrow shows that the staff tends to prevail the lower levels of RI. The blue arrow indicates that Administrators tend to hold sway at the higher levels. Overall, Administrators are 13% more committed to the RI strategy. Staffs will contribute ideas. But they are likely to be fewer in volume and less radical in content.

The difference in idea-generation is unlikely to be a major issue. Administrators will not feel a shortage of ideas. They are likely to have an overabundance from the Professor and Director levels. Administrators will probably have been learned by experience that staffs are not a productive source of major change options. Hence staffs are not likely to be pestered to generate ideas and options of a major nature.

It is unlikely that the staff level will feel “left out” of the major decision process. It is not a component of their role so their expectations will not be violated. In addition, the university culture typically dictates that major changes are “hashed out” in relatively public discussions. This gives everyone involved a sense of having an “input.”

Staffs are about 17% more committed to the disciplined Logical Processor (LP) style than are Administrators . This is the cumulative result of small differences over a broad range. The general configuration of the profiles of the two groups are aligned. This close “tracking” is shown in Graphic 7.

Graphic 7
ADMINISTRATORS vs. STAFF
LOGICAL PROCESSOR PROFILES

Overall both Administrators and staff are likely to see each other as having about the “right” level of commitment to methodical, deliberate and careful action. The difference in information processing profiles is likely to be of only minor consequence.

Graphic 8 shows the integration of all of the various levels more explicitly. Note that the bold green Administrator line breaches all of the various management levels.

Graphic 8
“I OPT” PROFILES OF ALL MANAGEMENT LEVELS


In general, the administrative management of universities appears to represent an effective bridge. The bridge goes both ways. Administrators are likely to effectively represent staff interests to the other management levels. They are also likely to effectively interpret Professor and Director concerns to staffs.


SUMMARY
The information processing compatibility among the management levels is not perfect. But it is structurally efficient and effective. Overall the differences between levels are functional. For example, the decisive action tendencies of Directors make sense in terms of their role in getting things done. The Professors idea-oriented RI tendencies directly address their role in creating new knowledge. The staff’s LP capacities are essential for smooth day-to-day operations.

The structural differences will give rise to “bumps in the road.” The decisive Directors are likely to cause Professors to see themselves as “left out” of decision making. The segment of Administrators holding a high analytical HA commitment may frustrate the Directors need to get things done. Administrators are likely to feel themselves “caught in the middle” in trying to balance off the needs of the various levels. These “bumps” are structurally built-in. A modest level of tension is probably needed for the university to function.

Locally there may be information processing disjoints that give rise to difficulties of consequence. But when viewed across all universities the “bumps” are likely to be more of an annoyance than a source of hostility. The picture painted by the 732 person sample of this study is one of general satisfaction but with a tinge of annoyance over one or another issue generated by one or another management level. The fact that the source of the discomfort changes with time is evidence that there is no fundamental structural problem.

In summary, universities are to be celebrated. They appear to have devised about as good of a management structure as is possible given their mission and constraints.

Monday, August 01, 2011

The Professors

By: Gary J. Salton, Ph.D.
Chief: Research & Development
Professional Communications, Inc.


ABSTRACT
The information processing profiles of 254 professors from 109 different universities showed an unexpected finding. A double peak in the idea-generating Relational Innovator (RI) dimension appears to create two distinct classes of professors. This condition exists across academic disciplines. It applies equally to both the hard and soft science disciplines.

The dual peak appears to be the result of the tenure system that favors two distinct activity patterns that give rise to the dual peak. The result appears ideal for the creation and maintenance of reliable knowledge. A corollary to this finding is that threats to the tenure system may compromise the knowledge generation role of the university.

An unintended consequence of the system is that negative “Rate my Professor” ratings are “built in”. They are likely be the result of the strategic style alignment of the students and one category of professors.


A video that both expands on and abbreviates this research blog can be viewed by clicking the icon on the right.


THE SAMPLE
Professors teach many subjects. Table 1 shows that the sample used here can be considered to reasonably representative of professors in the average university.

Table 1
SAMPLE AREAS OF PROFESSORSHIP

Professors also are differentiated by rank. Some are tenured (usually Full and Associate), some aspire to tenure (usually Assistant) and some are contracted teachers (usually Adjunct, Lecturers, Readers, etc.). Table 2 shows that the representation of each group within the sample is sufficient to be representative.

Table 2
NUMBER OF PROFESSORS BY RANK

Universities also differ in size, specialization, endowments, geography and other areas. Table 3 suggests that the range of universities represented in the sample is wide enough to characterize universities as an institutional class.

Table 3
UNIVERSITY SAMPLE DISTRIBUTION

In total, the sample population can reasonably be accepted as a fair representation of university professors in general. Its conclusions are likely to be generally applicable.


THE EXTERNAL VIEW OF PROFESSORS
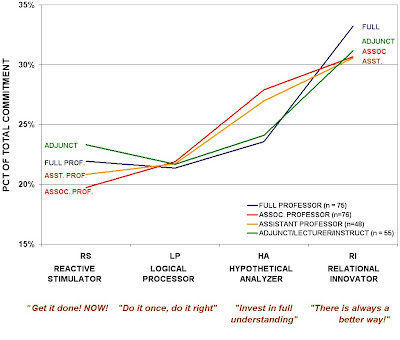
Information processing elections affect how professors teach, the nature of their research and the likely character of their interactions. “I Opt” technology measures these strategies in as “strategic styles.” These are specific combinations of input and output elections. “I Opt” is fully validated across all eight dimensions of validity and its reliability has been repeatedly checked under both normal and stressed conditions. Its 20-year use in virtually every segment of society further testifies to its relevance. The “I Opt” tool can be trusted as a tool of research. Its appliction to the various professor ranks is shown in Graphic 1.

Graphic 1
STRATEGIC STYLE DISTRIBUTION OF PROFESSORS

The red quotes on the bottom of the graph characterize the style in colloquial terms to facilitate understanding at the sacrifice of some level of accuracy.

The structural commonality between the ranks is visually apparent. All professors put little emphasis on action (the RS and LP strategies). The idea-oriented RI dominates followed by a strong preference for analysis (HA style).

Table 4
STATISTICAL SIGNIFICANCE OF STYLE DIFFERENCES
Expressed as a percent for ease of understanding (vs. p< 05, etc.)

Table 4 shows that the differences shown in the line graph are not material. One statistic (Full vs. Associate professor) approaches the 5% academic standard (p < .05) of significance. However, it is isolated and marginal in value. This argues that it can be considered an anomaly. For the purposes of this study all professors can be seen as being cut from the same cloth.

Profile commonality means that professors are looking at the world through the same set of glasses. They will tend to view issues in roughly the same way. They will tend to focus on roughly the same kind of variables, weight the factors in a similar fashion and arrive at a similar character of conclusion.

The above commonality invites stereotyping. People outside the academy live in more mottled environments. They interact with people of a more varied character. To them, the judgements and proclamations of professors are likely to seem strangely coordinated.

To the non-academic this “coordinated” view is likely to be seen as missing obvious factors that are fully visible to those living in more varied non-academic environments. The net result is that professors will tend to be judged as having an oversimplified view of reality. As a group, professors are likely to be viewed as being a bit “out of kilt” with the “real” world.


THE INTERNAL VIEW OF PROFESSORS
Unlike non-academic outsiders, insiders are able to contrast professors individually and over time. Graphic 2 plots the strength of the idea-oriented RI style for each academic rank. It suggests that they are likely see two distinct groups of professors based on the volume, scope and quality of idea generation.

Graphic 2
RELATIONAL INNOVATOR STYLE STRENGTH DISTRIBUTION
BY PROFESSOR RANK

Except for the non-tenure track adjuncts (green line), a distinct dual peak pattern is visible. These peaks are distinct clusters of professors. One group is about average in the idea-generating RI style. The other is highly committed. This unusual gap separates the two groups. It invites examination.

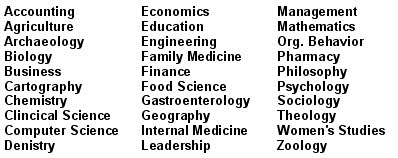
The subject being taught is a probable cause. Grouping the 254 sampled professors tests this hypothesis by discipline. The groups must be large enough to be representative. They must also be small enough to reveal differences. The balance that was used in this research is shown in Table 5.

Table 5
GROUPING OF PROFESSORS BY SUBJECT AREA


The basis of the groupings is structural rigor. The “constrained” group is governed by relatively well defined, stable theories. These theories are a framework against which new knowledge can be tested.

The “expansive” group has less well-defined theory. The “looser” theory provides fewer comparison points against which to test new knowledge. This difference in structure of the subject matter “should” result in different information processing approaches.

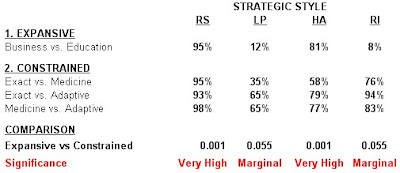
Table 6 tests whether the subjects in each “bundled” group are really using the same basic strategy. It shows that there is no significant difference between the disciplines “bundled” within each of the two groups (i.e., none of the values are less than 5% or p < .05). In other words the bundling appears to be a reasonable approximation of the information processing styles used by the professors sampled.

Table 6
STATISTICAL SIGNIFICANCE OF GROUPING
Expressed as a percent for ease of understanding (vs. p< 05, etc.)

The row at the bottom of Table 6 is a between group comparison. It shows that the two professor “bundles” really do use different information processing strategies. The profiles (i.e., the combination of strategic styles) used by the two groups differ in a statistically significant ways. Graphic 3 defines those differences.

Graphic 3
AVERAGE STRATEGIC STYLE COMMITMENT
BY AREA OF STUDY


The constrained group (e.g., exact sciences, medicine, etc.) puts more emphasis on analysis (HA) and less on new ideas and options (RI). This makes some sense. Well-defined theory makes new ideas costly. A professor’s time and resources in have to be invested in evaluating, assessing and validating the new knowledge against the existing theory. This is a “cost” of new ideas. More ideas, more cost.

The “looser” theory of the expansive group (e.g., management, learning, etc.) means that there is less to analyze. Assessment and validation is done with experimentation. For the professor this is much less expensive. There are fewer papers to write, fewer equations to run and fewer differences to reconcile. All you need do is to “try it.” Ideas are cheaper so you can afford more of them.

It is clear that the two “bundles” or groups of professors are really different in terms of the way they process information. The hard and soft sciences really do tap different information processing capabilities. But does the difference in subject matter (e.g. constrained vs. adaptive) account for the double RI peak? If it did, we would expect to find one peak in each subject matter group. The peaks would be in different places. The merged result would thus give us the double peak. Graphic 4 shows that the cause is not the result of this merging of two single peaks.

Graphic 4
RELATIONAL INNOVATOR (RI) STRATEGIC STYLE STRENGTH
BY AREA OF STUDY


A double peak appears in both groups. This means the source is not in the field of study. Something common to all areas of study and all academic ranks is causing it. The cause must lie somewhere in the structure of the university itself.

The tenure system is a prime candidate. Tenure can be achieved via two routes. One focuses on the creation of new knowledge. This speaks to the university’s knowledge creation mission. If the quality, quantity and scope of new knowledge is high enough, this is all that is needed. However, this is not the only route to tenure.

After realizing some minimum level of published new knowledge other qualities can weight into the tenure decision. Speaking (i.e., representing the university), teaching skill, graduate studies supervision and administrative contributions can also argue for granting tenure. These activities support the university’s knowledge transfer mission. Both routes are valuable to the university. Both types of professors are needed for the university is to fulfill its mission.

A consequence of the double peak can be seen in Graphic 5. Professors highly committed to the idea-oriented RI tend to have a lower commitment the disciplined LP and analytical HA strategies. Professors with a lower commitment to the idea oriented RI strategy tend to favor the more rigorous analytical HA and LP strategies.

Graphic 5
RELATIONAL INNOVATOR (RI) AND HYPOTHETICAL ANALYZER
STRATEGIC STYLE STRENGTH


The net effect of the interplay between the types of professors is that new knowledge is systematically tested. The knowledge created by professors on the upper peak will be tested in detail by the rigorous capacities of professors on the lower peak. The result is the culling substandard work.

All professors have an absolutely high level of RI. Professors on the lower peak will also create new knowledge. However, it is more likely to be of an incremental character. Professors on the higher peak will tend to generate knowledge of a “quantum leap” character. These abrupt transitions will always merit more focused challenge. They do not have the validating history of established knowledge.

The rival information processing postures of the two groups of professors thus create a critically important system. Acting together they insure that the knowledge being created is worth preserving. In other words, they act to create and maintain society’s store of reliable knowledge.

The existence of the double peaked idea oriented RI is a fact. The difference in the disciplined postures of HA and more spontaneous RI is a fact. Assigning its cause to the tenure system is a testable hypothesis. However, regardless of its cause the existence of the double peak has university level implications for its students.


STUDENT IMPLICATIONS
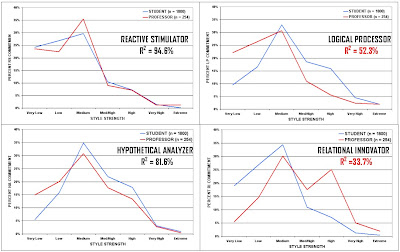
An unintended consequence of the double peak effect is its effect on the student’s “Rate my Professor” judgment. The ability of a processor to transfer knowledge is governed by the match of the professor and student’s information processing profiles.

Graphic 6
PROFESSOR AND STUDENT STRATEGIC STYLE DISTRIBUTION
(Professor n=254, Student n = 1800)


The student’s profile in Graphic 6 (blue line) is based on a sample of 1,800 graduate and undergraduate students from 31 different colleges and universities. The coefficient of determination (R2 or R squared) is cited on the graph. R2 puts a number on the visual differences. R2 is the proportion of fluctuation (i.e., variance) of one variable that is predictable from the other. Roughly put, R2 is a measure of how well one distribution matches another.

Graphic 5 locates the disjoint between students and professors. The high R2 in the Reactive Stimulator and Hypothetical Analyzers dimensions confirm these will not be a problem. On these dimensions the professor and student are “talking the same language.”

The Logical Processor dimension will create a bit of an annoyance. Students have a stronger desire for a disciplined, step-by-step procedure than does the professor. However, the R2 of 52.3% suggests that negative “Rate my Professor” comments based on this factor will be restrained—more like “grousing” than true complaints.

The RI graphic in the lower right box of Graphic 5 is the major disjoint. The R2 of 33.7% is concentrated on professors holding a position on the second high RI peak. Negative “Rate my Professor” complaints are likely to center on this specific group of professors.

The nature of the “disjoint” is likely to focus on professor’s ability to offer the student an uninterrupted stream of “what causes what and why” logic. The RI style uses fragmented knowledge in its processing. The style is also susceptible to diversion by an interesting comment or speculation. The net result is that the student must try to piece together a consistent “chunk” of knowledge that is understandable in terms of their way of viewing the world—i.e., their strategic profile.

A means of at least partially remedying this condition is readily available. Professors holding a position on the second peak can be taught to align their instruction with the student needs. The professors do not have to change their own strategies. They just have to adopt in their student’s perspective for the period in which they interact.

This is an economical and “doable” option. There is no need to involve all professors. Just those on the second peak. The only intervention needed is some relatively simple instruction. The affected professors only need to know how to suppress a “natural” approach for the duration of a class or meeting. They then need only to know what to substitute for their “natural” approach. This process can realign the strategic style profiles on a temporary basis. That is all that is needed for learning.

The result will not be perfect. But it will be a step forward. The transfer of knowledge will be better served without sacrificing knowledge creation. The only difficulty will be convincing the professors that their way is not the only “right way.” That could be the real challenge.

CONCLUSION
This study finds that all professors share a basic, overall strategic profile that favors new ideas and careful analysis. This commonality lends some justification to the popular characterizations of professors as a bit “out of kilt” with general society.

A double peak was found on the idea generating RI dimension among tenure track professors. Two distinct groups of professors appear to populate the academy. One is well suited to the creation of “paradigm shifting” knowledge. The other is ideal for testing new knowledge. The result of their interaction is reliable knowledge. .

The university’s knowledge creation mission appears to hinge on the tenure system. Recognizing excellence in both knowledge transfer (the lower RI peak) and knowledge creation (the upper RI peak) creates the dual peak. This suggests that tenure is not just useful in motivating individual professors. It is a system selection mechanism. It creates a system of two complementary, contesting components that act together to insure the consistent creation of reliable knowledge.

A corollary of the twin peak tenure hypothesis is that were the tenure system to be replaced, there is a strong probability that the replacement system would not create the twin peak profile. The result could be the compromise of a critical component of the university’s knowledge creation mechanism. Caution is in order.

Finally, nothing comes without a price. The price here is that the upper peak professors will tend to accumulate more negative “Rate My Professor” comments. This testifies to a structurally based compromise of the university’s inter generational knowledge transfer function. However, this can be ameliorated if not resolved through a simple focused educational process.

Thursday, March 10, 2011

Predicting Strategic Style Change

By: Gary J. Salton, Ph.D.
Chief: Research & Development
Professional Communications, Inc.


SUMMARY
This research outlines a study of over 1,500 test-retest surveys spaced up to 12.7 years apart. The study uses a natural design that identified the degree and direction of change in “I Opt” strategic styles and profiles over time.

The study found that a majority of “I Opt” dominant styles remained constant over the long time period covered by the study. Many of the dominant style changes that did occur did not represent major behavioral shifts. Rather the granular nature of rank order (i.e., ordinal) measurement tended to exaggerate behavioral change estimate

It was found that a majority (83%) of the dominant styles that did changed followed a predictable pattern. The changes appear to be governed by the principles of social economics and non-optimality. The effects of aging were also identified. Aging effects were statistically significant but of relatively modest consequence.

Finally, the study identified a single strategic style that was most resistant to change. This stability appears to be due to the flexible structure of the input and output strategies being employed.

A video summary is available on YouTube and can be accessed by clicking the icon to the right.


BACKGROUND
Most tools in the field find their roots in psychology (e.g., Myers-Briggs®, DiSC®, 16PF®, FIRO-B®, etc.). They believe that they are measuring a “hard wired” behavioral map. They may informally acknowledge that change occurs. But none offers an explicit, testable change mechanism.

“I Opt” ® is unique. It is based on information processing. It is focused on the behavior generated as the human being attempts to navigate a particular environment. If the environment is stable, their behavior is stable. If the environment changes they either adapt their behavior or exit to a more comfortable terrain.

The choice of particular behavior to adopt is guided by social economics. Some behavioral changes are harder than others. If the same goal can be reached by two different behavioral choices—one hard and one easy—they will choose the easy one. An obvious but important observation.

The adaptive behavioral choice does not involve optimization. Optimality implies that some best possible end condition is known. This is impossible in ever-changing social situations. “Good enough” is the typical standard. Once a “good enough” result is regularly obtained behavior again stabilizes. Adequacy is a governing principal of style choice.

“I Opt” is indifferent as to whether or not there is a “hard wired” component to human nature. It works whether it is there or not. Any change discovered must be due to factors other than psychology since that behavior is fixed by definition. The fact that environment affects behavioral choice is deemed so obvious as not to required explanation here.


STYLE CHANGE
As applied in organizational research “style” is a term applied to a typical pattern of behavior. It is usually assessed using ordinal (i.e., rank order) measures. This form of measurement has serious limitations.

For example, DiSC® allows you to say that a person is more “dominant” than “compliant.” But you cannot say that a person is twice as likely to use one style versus the other. It does not matter if you assign the numeral 2 to “sometimes” and 3 to “often.” You will still be dividing “sometimes” by “often.” The inability to assign a magnitude to a style means that only general, non-specific and somewhat vague assessments can be offered.

The underlying concept of “style” does have practical utility. Practitioners must convey knowledge in a manner that can be understood. Styles offer that vehicle. The problem lies in how style is measured. “I Opt” has overcome this problem by using exact (
i.e., ratio scale—like a ruler) rather than rank order calibration. This gives “I Opt” a far broader range than traditional tools.

For example, we can always reduce time, say 12.05PM, to “daytime.” The reverse is obviously not true. “Daytime” is not always 12:05PM. “I Opt” can emulate traditional rank order tools. Traditional tools cannot emulate “I Opt.” This means that “I Opt” can address issues using broad categories where appropriate but is not confined to that level.

Exact measurement also means that the theory underlying “I Opt” can be disproved. This is the essential quality of any scientific theory. Without precise measurement no experiment can be designed that could completely disprove the “hard wired” claims of traditional tools. The inability to disprove them relegates these traditional tools to the realm of speculation. That speculation may be true. No one will ever know for certain. However, even if unproven traditional tools can be useful. They need not be discarded.

Definitive theory, measurement capabilities and a scientific basis makes “I Opt” a unique assessment tool. It is in a class or category by itself. This means that it can be used in conjunction with any of the historically accepted tools. “I Opt” is addressing different things in a different way. Since they work on different dimensions, they cannot contradict each other. This means that they can be combined and used together if conditions warrant.


THE SAMPLE
This research tests the theoretical expectations and principals outlined above using evidence-based data. It draws on over 12 years of repeated measurements. Table 1 outlines the general characteristics of the sample used.

Table 1
GENERAL SAMPLE CHARACTERISTICS


The size of the sample is wide, large and diverse. It is a meaningful representation of the universe to which “I Opt” technology applies.


STUDY DESIGN
Organizations have used “I Opt” technology continuously since 1994. The technology was used purposefully in development efforts involving teams, departments, and work groups. It was also deployed in programs involving leadership development, conflict resolution and other similar areas. This purposeful use means it is not contaminated by “experimentation” bias. In other words, the participants did not consider it a “game”, toy or other form of diversion.

During the period of the study people participated multiple activities using “I Opt.” The time horizon was long enough for significant changes in life circumstances to occur. People got married, had children, were promoted, changed location and so on. Testing and retesting over this long period provides “I Opt” with a rock-solid base on which to test and extend the already strong foundation on which it rests.


RETEST TIMING
The time periods between test and retest was determined by business needs. Therefore the periods between test and retest vary widely. This is an advantage. There is no preordained period over which change is “suppose” to occur. Graphic 1 shows the distribution retests over time.

Graphic 1
TIME DISTRIBUTION OF RETESTS
The distribution is obviously skewed. The reason is that inclusion in the study design requires that the person remain with a firm. The average tenure of males in the private sector dropped 15.5% in the 1973-83 era to 11.4 years in the 1996-2006 period. (Farber, 2008). Since the economic collapse in 2008 it has undoubtedly dropped still further. Fewer people remaining with an organization over time means that there are fewer people to retest. Hence the skewed distribution.

However, the sample size is large. Retests beyond the 2.7-year average retest period totaled 556 (37% of the sample). This means that long tenured people are well represented. This reduces the potential bias arising from inadvertently measuring one cohort (e.g., Gen-X’s, baby boomers, etc). Overall, the retest distribution appears to be a fair representation of what can be expected in typical organizational situations.


POPULATION LEVEL CHANGE
Styles cannot change without affecting the entire behavioral profile of a person. For example, if “dominance” increases there is less time left in which “compliance” can be expressed (i.e., DiSC). Increase any style and something else has to change to accommodate it.

Graphic 2
CHANGES IN THE POPULATION PROFILE
(n =1515)


Graphic 2 measures change the overall behavioral profile of the sample population. It says that the whole population (i.e., n = 1515) did not substantially change in the average 2.7 years between test and retest. Individual changes netted out. This is exactly what would be expected and predicted by “I Opt” theory.

A major change in the profile of an overall population would require the information flows or meanings used in a society to change. While there have been “tweaks” (e.g., faster Internet lines, another recession, etc.) the basic social substance has not changed. The government still functions, schools are still teaching and stocks are still being traded. “I Opt” reflects this consistency. This result lends support to theory underlying “I Opt.”


COMPOSITE LEVEL CHANGE
The sample of 1,515 retests can also be looked at individually in terms of “style” changes. While society many not have changed, the circumstances of many individuals within that society most certainly have. Using the “style” concept these changes would be most visible in a change in the dominant style—the style with the highest rank order. Looked at in this manner, rank is all that is important. The magnitude of change does not matter. Graphic 3 shows the results for the dominant style of the study participants.

Graphic 3
CHANGES IN DOMINANT STYLE
(n =1515)

The dominant style of most people in the sample did not change. But a significant minority did. Rank order (i.e., ordinal) measurement does not tell us by how much. However it was enough to change the rank order of strategies employed. The first step in understanding change is to try to figure out the magnitude of the change. In other words, we want to know if the change in behavioral preference is a lot or a little.

Graphic 4 shows how many individual survey retest responses (e.g., "questions") changed style values among all 1,515 re-testers. This is a measure of actual change. It may not be reflected in a change in dominant style. It could be merely a change in emphasis. For example, a style may have increased or decreased without changing rank order. Graphic 4 shows that an average of 2.5 “I Opt” responses that affected style scores changed between test and retest.

Graphic 4
NUMBER OF RESPONSE CHANGES
IN ALL STYLE CATEGORIES

(n =1515)

It is worth noting that only 7% of the sample had no change at all (left-hand column on Graphic 4). This would suggest that over an average period of 2.7 years most people encounter some kind of change. This reconfirms the ubiquitous nature of change. Change is the one constant of life

Graphic 5
RESPONSE CHANGES IN DOMINANT STYLE CATEGORY
DOMINANT STYLE CHANGED
(n =651)

Graphic 5 shows the number of retest response changes among those whose dominant style (i.e., rank order position) actually shifted. The column showing “0” change in dominant style changed responses merit explanation (left hand column on Graphic 5). These are the cases where the original score for the dominant style did not change. But peripheral styles did change. Some of these changes were enough to boost another style to the dominant category even when the dominant style stayed at the same level.

Combining Graphics 4 and 5 tells a story. On average, 2.5 responses on the 24-question survey changed for all members of the sample. Graphic 5 shows the same data only for surveys where the dominant style (rank order) changed. Here the average number of responses that changed was 3.5. In other words an average difference of 1-response is enough to flip a style from one category to another.

The response analysis tells us that people change over time. Most people do not change their dominant style (57%). Those that do change (43%) do not change by much. However, we can get a firmer fix on the actual magnitude of change in the styles by using the exact measurement capabilities of ‘I Opt.”

Graphic 6 compares the test and retest profiles of the surveys where the 43% of the sample where the dominant style changed. The change is discernible. But it is not a lot. It is likely that the cruder rank order measurements of the traditional tools would judge this overall profile to be unchanged. “I Opt”, on the other hand, is able to recognize and measure the small but actual changes in survey responses.

Graphic 6
CHANGES IN THE AVERAGE PROFILE
WHERE DOMINANT STYLE CHANGED
(n =651)


This analysis has shown that group level behavior—as measured by “I Opt”—is relatively stable. This is true whether the group includes everyone or just those who changed enough to flip their dominant style. This finding invites explanation.

One possibility is obvious. The social network and technologies of a particular society create unique information flows. These flows create a need for certain levels of each of the “I Opt” styles. Social adjustment mechanisms keep things in balance. Compensation levels for particular jobs can be increased or decreased. Social status of particular activities can rise or fall. These adjustments can cause people whose profiles lie close the expressed need to shift. The result is an automatic stabilization centering on the needs of the society at any particular point. This is a testable hypothesis. If it is true we should expect different societies to have different global profiles. All we need do is to look.


INDIVIDUAL LEVEL CHANGE
Practitioners involved in global level of analysis (e.g., culture studies) can make use of the group level assessment immediately. Practitioners whose work is focused on individuals require a deeper level of assessment. For this we have to look at an individual level.

The first thing we need is a baseline. Graphic 7 compares all of the retest surveys (n = 1515) with those of random pairs of people (i.e., the columns in Graphic 7). The columns were constructed by drawing random people from our 60,000+ database and calculating the degree that the profiles of the selected people overlapped. This is the equivalent of the experience a person would have if they were to interact with random people on any particular street.


Graphic 7
DISTRIBUTION OF TEST-RETEST OVERLAP CHANGES
(n = 1,515 retests, n = 100 random pairs)


On average, a random pairing of people produces an overlap of about 40%. The average overlap of retest surveys is 61.1%. The difference is statistically significant (p< .00001). This is a condition “I Opt” theory predicts.

People tend to live in stable environments. Most people go home to the same house each night, the same kids show up at the dinner table and they take the same route to work the next morning. But some changes do occur. Promotions, new babies and job losses are just some dislocations over the period measured here. “I Opt” theory would recognize both the consistency and change in life circumstances.

Graphic 7 bears out “I Opt” predictions. Adjustments did occur but they did not take people back to point zero (i.e. random pairings). People tended to tweak their existing profiles. Strategies that were useful in the stable portion of their lives tended to be preserved. That portion of their life that did change was met with changes in their style elections. The net effect is that the test-retest overlaps stay at higher levels than would be expected by pure chance. That is exactly what is shown on Graphic 7.


ANALYSIS OF INDIVIDUAL LEVEL CHANGE
The consistency displayed in Graphic 7 requires no explanation. The change element invites it. One potential explanation of change might be simple aging. Age affects biology and biology affects behavior. Graphic 8 shows that age has an effect. The longer the time period between test and retest (i.e., more time for aging to occur) the less the before and after profile resembled each other. However, the effect is small.

Graphic 8
CHANGE IN RETEST OVERLAP WITH TIME
(n = 1515 retests)

The mathematical notation in Chart 8 shows that there is about -0.5% (i.e., half of one percent) a year change in overlap by year due to time. It is reasonable to see this as the natural affect of adjustment due to normal aging processes. It is not enough to explain the entire change distribution we saw in Graphic 7. However the R2 of 95% suggests that this source of change is real.

Since the change due to time alone is small it is reasonable to look to changes in the local environment to explain the major portion of the observed change. The sources of environmental change are probably infinite and are not of significance to “I Opt” theory. Any change for any reason that causes a significant deterioration in the success of the current behavioral strategy is a motive (i.e., reason) for change.

However, “I Opt” theory can predict the direction of change. Remember social economics mentioned in the first part of this article? It says that people will try to minimize the cost any change. This is best achieved by preserving as much of the present behavior pattern as possible. This can be read directly from the “I Opt” profile by looking at adjacent axes on the graph.

The “I Opt” graphic is constructed so that adjacent axis share one or another information-processing component (input or output). By moving to an adjacent axis the individual is preserving at least one element of information processing strategy that they are using to navigate life. This lowers the cost of the change.

The easiest shift that can be made is to change emphasis. This would happen when a person promotes their secondary style to primary status. They simply begin using a style with which they are already familiar—their current “fallback” option—more intensively. Table 2 tests this hypothesis.

Table 2
SECONDARY STYLE PROMOTED TO PRIMARY
SCORES ARE AVERAGED PERCENT OF TOTAL FOR EACH CATEGORY
(n = 651 retests)


The original secondary style is highlighted in yellow in the original test section of Table2. The new primary style is highlighted in the retest section (i.e., right side) in bolder enlarged characters.

In a majority of cases the original secondary and final primary styles are in the same position. In 10 of the 12 categories (83%) the change in style behaved exactly as predicted. On average, people just adjusted emphasis. They used their secondary style more. This increased its rank order position. The dominant style (rank order position) changed but a consistency in the behavioral pattern is preserved.

The two cases where this did not happen are boxed in red. In these two cases the original secondary style was almost as strong as the style that ultimately evolved into the primary style on retest. In other words, people were already heavily using the style that ultimately became their primary style. They were just not using it heavily enough to raise the rank order to a secondary status. But there is also another possible reason.

Major environmental dislocations that invalidate both input and output strategies can occur. This would cause a global change in an individual’s strategy (both input and output). Major dislocations of this nature are rare. Those that do occur can often be anticipated. New babies give at least 9 months advanced warning. Layoffs are often preceded by losses and deteriorated working conditions. Serious illness is usually accompanied by increasing medical interventions. These “flags” may have had a role in moving the percentages in the red boxes closer together. In other words, people may have been preparing for an anticipated change in their environment.

The two HA and LP boxed areas in Table 2 are representative of a class. There were individuals in each of the four categories that made a total transition (input and output change). Table 2 worked on averages. In the two cases which escaped the boxed effect their strength was not enough to move the average—but individuals within those groups did make total transitions.

Table 3 shows the effect of those involved in a total transition of their information processing strategy more clearly. The “Focus Change” column on the right shows which element of the strategy changed. The designation “BOTH” indicates a total transition.

Table 3
SOURCE AND AMOUNT OF CHANGE
(n = 651 retests)

Table 3 looks at that portion of the sample whose dominant style changed. It rank-orders change categories by the percent of surveys falling within that category. A pattern is clearly visible and is governed by the principles of social economics and style adequacy.

A change in the output strategy (action vs. thought) is always the top of the list. The reason is that this is the simplest and least expensive approach. Just change the output from thought to action or vice-versa. It is a one-step strategy.

A change to the input strategy (unpatterned vs. structured) is the next most frequent. This is a two-step process. New kinds of information must be acquired. Then effort must be expended to organize and understand the new information. It is more expensive and therefore less used.

A total transition strategy—change in both input and output—are the least used. This is a three-step process. New kinds of information must be acquired, it must be organized to be understandable and then it must be acted upon in an unfamiliar way. This is the most expensive strategy and the least used by a substantial margin.

The ordering of the strategy changes also evidences the operation of the adequacy principle of strategic style selection. People were selecting strategies that worked “good enough.” If some form of optimization were operating it is unlikely that the ordering of change would be the same in every set.

The analysis of individual changes dramatically confirms the theory (what causes what and why) underlying “I Opt” technology. The data demonstrates continuity in the transition process (Graphic 7). It is also able to capture the universally acknowledged maturation effect (Graphic 8). The concept of a style change economy was forcefully confirmed by the use of secondary styles as the principal transition vehicle (Table 2). And finally the order of transition (Table 3) evidences the operation of the social economics and style adequacy principles.

Table 4
DIFFERENCES IN TRANSITION FREQUENCY


Table 5 shows that the difference between the RI (i.e. 35%) and other style change rate is statistically significant for the HA and LP (highlighted in yellow) and almost so for the RS (highlighted in green).


Table 5
SIGNIFICANCE OF RATE OF CHANGE DIFFERENCES

The reason for the RI’s greater resistance to change is likely to be found in the structure of its information processing strategy. The RI uses unpatterned input. This means that the style can accept and use any form of input. The amount of information obtained may be less than for the structured HA and LP styles but it is still usable without the need to change style orientation. Remember that optimality is not at issue. Adequacy is all that is needed.

The other information-processing element is the RI’s use of thought output (e.g., ideas, options, etc.). This is infinitely flexible. Unpatterned input means that the RI is not bound by the rigor of the HA’s structured thought-based strategy. Inconvenient discrepancies can be ignored and returned to later if further definition or specification is needed. The reduced need for rigor means that a relevant response (i.e., output) can be offered to meet almost any situation. It does not have to be perfect, just “good enough.”

The combination of unpatterned input and thought output means that the RI is the most flexible of the styles. The RI style can more easily emulate any of the other styles—at least for a time. Since most transactions are relatively brief, this capacity allows the RI to “get by” in most situations. The ability to “get by” allows the RI to more easily maintain their approach in the face of environmental change. Hence they have the lowest rate of change. The data does not “prove” this theoretical reasoning but the author is at a loss for any other reasonable causal chain.

An informal confirmation of the logic offered above is found in the many leadership studies that have been done (Salton, various). They all find the dominance of the RI style to be characteristic of people in senior leadership positions. This is no accident.

Leaders typically must guide people who use a variety of styles. The higher the level, the more variety will likely be encountered (e.g., more functions, more people, etc). The flexibility of the RI is well suited to understanding and contributing to these various postures. This gives the RI an edge in rising to leadership—whether formal or informally gained.

Keep in mind that there is no such thing as optimality in social interactions. Adequacy is all that is needed. Thus it is not necessary that a leader “fully” appreciate the contribution of other styles. It is only necessary that the leader understand “well enough” to provide reasonably correct directional guidance.


RESEARCH IMPLICATIONS
The findings of this research offer insight of immediate value to the practitioner. For example, this paper has identified the kinds of change that will be easy or hard. This can be useful in establishing job progressions that are likely to yield success for both the individual and the organization.

The study has also alerted the practitioner to the fact that dominant styles are “sticky.” Most do not substantially change even over long periods of time. What this means is trying to change a persons “I Opt” strategy will always be a difficult undertaking. It can be done but it is not cheap. Clients looking for “quick fixes” to fundamental strategic postures are likely to be disappointed. This study provides the practitioner with hard data with which to make this case.

The study has also demonstrated that changing a “style” is easier than changing observable behavior. A style change only requires a change in rank order. The study has shown that on a global basis this happens with an average change in only 1 response (see Graphics 4 and 5). Even when this happens the change in the entire repertoire of behaviors is small (see Graphic 6). Practitioners should expect to continue to work with people and organizations even after “style” based measurements tell them that the job is done. It probably is not.

This paper further identified the degree of difficulty that can be expected in any change. Table 3 showed that the easiest change is redirecting output. Redirecting input is next. This knowledge can be very useful in areas such as leadership training.

The study also alerts the practitioner to some more subtle factors. Both the leadership edge and relative resistance of the RI to change probably rests on its flexibility. Observed changes may be simply temporary accommodations. Knowing this can cause the practitioner to make their own accommodations in their development initiatives.

“I Opt” represents a quantum leap beyond the capacities of traditional tools. It not only anticipates change but can identify how much actually occurs in the “real world.” It goes on to explain what changes, why it changes, how much it changes and the likelihood that it will change in a particular direction. In other words, “I Opt” theory accurately predicts what is going to happen in the real world as well as explaining what has happened.

The combination of a quantum leap in scope, accuracy of predictive capability and solid, testable reasoning creates a much more powerful tool than previously available. Both practitioners and theoreticians can deploy this tested and validated tool immediately to address issues being confronted in today’s world. The result is likely to benefit both the practitioner/theoretician and the organization to which it is applied.


TRADEMARKS
® IOPT is a registered trademark of Professional Communications Inc.
® MBTI, Myers-Briggs Type Indicator, and Myers-Briggs are registered trademarks of the MBTI Trust, Inc.
® FIRO-B is a registered trademark of CPP, Inc.
® DiSC is a registered trademark of Inscape Publishing, Inc.
® 16PF is a registered trademark of the Institute for Personality and Ability Testing, Inc.


BIBLIOGRAPHY
Farber, Henry F., 2008. Employment Insecurity: The Decline in Worker-Firm Attachment in the United States. Princeton University: CEPS Working Paper No. 171, June 2008, page 6. Retrieved from http://www.princeton.edu/ceps/workingpapers/172farber.pdf on February 2, 2011.

Inscape Publishing (2005). DiSC Validation Research Report. Inscape Publishing, Minneapolis, MN. Retrieved from http://www.discprofile.com/downloads/DISC/ResearchDiSC_ValidationResearch
Report.pdf January 4, 2011.

Salton, Gary (2011), IOpt Style Reliability Stress Test, http:\\garysalton.blogspot.com.

Salton, Gary (Various):
  • Salton, Gary (November 2010) Sales Management and Performance. http://garysalton.blogspot.com/2010/11/sales-management-and-performance.html
  • Salton, Gary (October 2010) City Management http://garysalton.blogspot.com/2010/10/city-versus-corporate-executive.html
  • Salton, Gary (September 2009). The Nursing Staircase and Managerial Gap http://garysalton.blogspot.com/2009/09/nursing-staircase-and-managerial-gap.html
  • Salton, Gary (September 2008). Hierarchy Influence on Team Leadership
  • http://garysalton.blogspot.com/2008/09/hierarchy-influence-on-team-leadership.html
  • Salton, Gary (August 2008). Engineering Leadership. http://garysalton.blogspot.com/2008/08/engineering-leadership.html
  • Salton, Gary (June 2008). The Pastor as a Leader. http://garysalton.blogspot.com/2008/06/pastor-as-leader.html
  • Salton, Gary (May 2008). Fitting the Leader to the Matrix http://garysalton.blogspot.com/2008_05_01_archive.html
  • Salton, Gary (October 2007). Leadership, Diversity and the Goldilocks Zone http://garysalton.blogspot.com/2008_01_01_archive.html
  • Salton, Gary (October 2007). How Styles Affect Promotion Potential http://garysalton.blogspot.com/2007_10_01_archive.html
  • Salton, Gary (November 2006). Gender in the Executive Suite http://garysalton.blogspot.com/2006_11_01_archive.html
  • Salton, Gary (October 2006). CEO Insights http://garysalton.blogspot.com/2006_10_01_archive.html

Harvey, R J (1996). Reliability and Validity, in MBTI Applications A.L. Hammer, Editor. Consulting Psychologists Press: Palo Alto, CA. p. 5- 29.