Chief: Research and Development
Professional Communications, Inc.
INTRODUCTION
This study uses 2,195 observations from 430 different organizations in 26 different countries as a lens to examine Human Resource thought diversity. The research focuses on non-supervisory HR professionals responsible for the actual delivery of services. The diversity of thought affects how HR is seen, how it is managed as well as its ability to function as a cohesive unit.
 |
| Click icon to see video |
THOUGHT DIVERSITY
Thought diversity shapes the way a subject is operationally understood. It is determined by the variables considered, by the method of assessment and by the intended course of action. These factors are taken into account within the information-processing framework of “I Opt” technology.
Figure 1
THE UNDERLYING PARADIGM FOR THOUGHT DIVERSITY

The input variable in Figure 1 defines what is considered to be relevant to the issue at hand. Some people will look at a subject in detail; others will focus on general aspects. Some will relate an item to other things; others will view the subject in isolation. These input elections determine the scope within which a subject is understood.
Output preferences set direction. Some people form plans. Others will act without the need for consideration. Some people stress speed. Others emphasize reliability. Some people measure success by volume. Others gauge success by quality. Output is what other people see. Some elections will display thought. Others will display action. The balance of these choices determines the “personality” of the individual and the character of the relationships within a group.
Process is the link between inputs available and the output possibilities. “I Opt” addresses this the same way Einstein handled space-time in physics. Process tells input what to look for and accept. It then tells output what is possible based on the input available. It iteratively bounces between input and output until a satisfactory combination is achieved. What is “satisfactory” ultimately determines the final position on an issue.
Anything and everything must go through “I Opt” paradigm to find any social expression whatsoever. Variation in that social expression is what is called thought diversity. Thought diversity will always be present. The only question is one of degree.
THE VALUE OF THOUGHT DIVERSITY
The popular business press treats thought diversity as a universal good. “I Opt” technology views it as a tool. It should be deployed when it serves an objective. It should be restrained when it frustrates it.
Thought diversity is of value when addressing vague, wide-ranging or multidimensional issues. These conditions create uncertainty. Different “understandings” can improve the odds that one or another option will offer the best solution.
But thought diversity is not free. Differing understandings compromise coordination. Positions must be argued out and reconciled. If working on a well defined issue this is an unnecessary expense. For example, how much thought diversity do you want around an operating table during brain surgery?
Viewing thought diversity as a tool implies the need for some kind of quantitative measure. There must be a basis to determine how much diversity is “right” for a particular function.
MEASURING THOUGHT DIVERSITY
“I Opt” converts the basic
information-processing model into four patterns of behavior called “strategic
styles.” These styles can be measured exactly. The first 5 minutes of the Team Tension video (see #1 in Footnotes) explains how this is done. THE VALUE OF THOUGHT DIVERSITY
The popular business press treats thought diversity as a universal good. “I Opt” technology views it as a tool. It should be deployed when it serves an objective. It should be restrained when it frustrates it.
Thought diversity is of value when addressing vague, wide-ranging or multidimensional issues. These conditions create uncertainty. Different “understandings” can improve the odds that one or another option will offer the best solution.
But thought diversity is not free. Differing understandings compromise coordination. Positions must be argued out and reconciled. If working on a well defined issue this is an unnecessary expense. For example, how much thought diversity do you want around an operating table during brain surgery?
Viewing thought diversity as a tool implies the need for some kind of quantitative measure. There must be a basis to determine how much diversity is “right” for a particular function.
MEASURING THOUGHT DIVERSITY
Table1 shows how “I Opt” measurements can be converted into a percent of a possible maximum. These can then averaged to get a measure for an entire group.
Table 1
ILLUSTRATION OF MAXIMUM COMMITMENT CALCULATION
ILLUSTRATION OF MAXIMUM COMMITMENT CALCULATION

Thought
diversity is simply the inverse of commonality. It is lowest when one style had
100% commitment. Everyone approaches
issues in the same way. Thought diversity is highest when each of the four
styles is has an equal 25% commitment. Here there would no initial agreement on
how an issue should be approached.
The absolute
“distance” (i.e.,
ignoring the sign or direction of difference) of each style to all others creates an index. The range
of the index is between 0 and 300. Table
2 shows this calculation using the sample group from Table 1.
Table 2
CALCULATION OF THOUGHT SIMILARITY AND DIVERGENCE
Percentage POINT Difference in “I Opt” Scores
CALCULATION OF THOUGHT SIMILARITY AND DIVERGENCE
Percentage POINT Difference in “I Opt” Scores

The
probability of a group being 100% thought diverse or 100% identical is
vanishingly small. There is also no a priori reason to expect any particular
distribution of diversity scores. However, using a database of 2,137 real world
teams (sizes
2 to 33 people) thought
diversity levels actually being used in the field can be calculated to give an
indication of a “normal” level. Graphic
1 shows this distribution.
Graphic 1
DISTRIBUTION OF ACTUAL TEAMS
VERSUS THOUGHT DIVERSITY SCORES
VERSUS THOUGHT DIVERSITY SCORES

PROFESSIONAL GROUP THOUGHT DIVERSITY
Earlier
studies have shown that different organizational levels tend to favor
particular thought patterns (see Organizational Rank and StrategicStyle--#2 in footnotes).
Including management in a sample would increase the commonality and understate
diversity. Therefore this study confined
itself to non-management professionals.
Thirteen recognized professional functions were used as a context for HR. The results shown in Table 3 show the staffs arranged in order of increasing commonality (lessening thought diversity).
Table 3
COMPARATIVE THOUGHT DIVERSITY BY
ORGANIZATIONAL FUNCTION

ORGANIZATIONAL FUNCTION
It is useful
to confirm the viability of the sample being used. Graphic 2 contrasts the
Diversity Index of the sampled staffs to the more wide-ranging sample of the
2,137 teams (Graphic
1). Graphic 2 shows that the distribution
geometry of the two groups is of roughly the same character. The difference in the height of the curves is
due to sample size. Percentages get bigger when the denominator smaller (13 staffs vs. 2137
teams). Overall, the
Diversity Index appears to be a reasonably valid measure of staff diversity.
Graphic 2
THOUGHT DIVERSITY INDEX PROFILE: TEAMS VERSUS STAFFS
THOUGHT DIVERSITY INDEX PROFILE: TEAMS VERSUS STAFFS

ASSESSING STAFF DIVERSITY
People judge
things using their daily experience rather than absolute standards. The average
value of the Thought Diversity Index for all staffs is a reasonable expression
of this “normal” level. Converting staff scores from Table 3 into percentages of
this average gives an understandable graphical image of thought diversity. This
is shown in Graphic 3.

Graphic 3
PERCENTAGE DIFFERENCE OF STAFFS TO OVERALL AVERAGE
PERCENTAGE DIFFERENCE OF STAFFS TO OVERALL AVERAGE
The
high diversity of Sales/Marketing is not surprising. The sales component faces
the outside world. It must meet the needs and expectations of a variety of
customers. The marketing element must accommodate a host of different media
with their different marketing standards. In this situation thought diversity
has high value.
On
the other side, medical’s high commonality position is also expected. This
category consists primarily of nurses. They are bound by strict requirements on
what must be done and when to do it.
Similarly the rules, contracts and accounting conventions act to bind
Finance/Accounting into a degree of commonality. Job constraints rather than personal elections are what appear to cause professionals in these high
commonality areas to adopt similar methods.
Human
Resources is the anomaly. Popular
perception is that HR tends toward a confined perspective. Finding it among the most highly thought
diverse of the staffs warrants for further exploration.
HUMAN RESOURCES THOUGHT DIVERSITY
Larger HR functions usually combine two distinct groups. Traditional HR consists of activities needed to keep an organization functioning. Learning & Development (L&D) focuses on improving personal and organizational capacities. Table 4 compares the level of thought diversity in these two components.
Larger HR functions usually combine two distinct groups. Traditional HR consists of activities needed to keep an organization functioning. Learning & Development (L&D) focuses on improving personal and organizational capacities. Table 4 compares the level of thought diversity in these two components.
Table 4
THOUGHT DIVERSITY INDEX COMPARISON
THOUGHT DIVERSITY INDEX COMPARISON
TRADITIONAL HR vs. LEARNING AND DEVELOPMENT
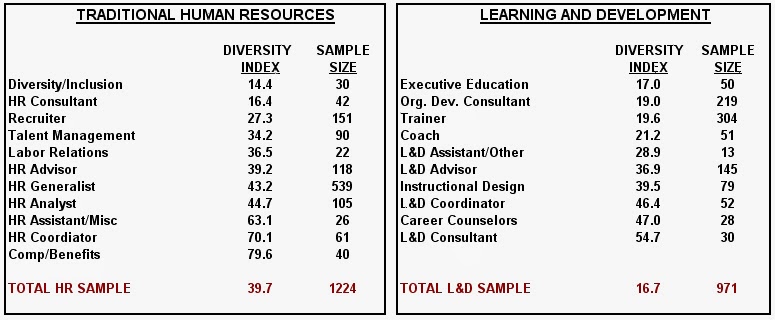
The
difference in thought diversity is obvious at a glance. Traditional HR is over twice as likely to
adopt a common posture as is L&D.
Graphic 4 plots thought diversity with traditional HR and L&D
considered as unique staff functions.
Graphic 4
PERCENTAGE DIFFERENCE OF
STAFFS TO OVERALL AVERAGE

L&D
is by far the most diverse of any of the staff groups. It is 62.4% more diverse
than the average of all staffs. But even traditional HR is 10.6% more diverse
than the overall staff average. The reason is not difficult to find.
The raw
material of both HR components—the human being--is the most complex entity in
the known universe. The materials of the engineer do not change their mind as
they move from one product to another.
The debits and credits of the accountants do not change relative
position in the general ledger regardless of where or when they are viewed. The
manufacturing production line is in the same place and moves in the same
direction day after day. The raw
material of HR has none of this built-in consistency. It is the only raw
material that can change its mind. This variability tends to place high value
on thought diversity.
ANALYZING THE COMPONENTS OF HUMAN RESOURCES
Graphic 5 highlights the difference between traditional HR and Learning & Development.
Graphic 5
“I OPT” STRATEGIC STYLE
PROFILES
TRADITIONAL HR vs. LEARNING
AND DEVELOPMENT

L&D is almost 25% more inclined to use the idea generating RI strategy. Traditional HR invests about 13% more in precise execution (LP) and 10% more in deeper analysis (HA). This tradeoff makes sense. Policies, labor laws and other constraints limit traditional HR’s ability to successfully innovate. Lessened ability to innovate focuses attention toward excellence in planning (HA) and execution (LP).
Graphic 5 presents the two components of HR as if they are uniform entities. That is not the case. Both groups are themselves composed of subunits. Each of these subgroups has their own degree of thought diversity. The “I Opt” style profile lets us divide these subunits into groups that share roughly common approaches. The result of this categorization for Traditional HR is shown in Graphic 6.
Graphic 6
TRADITIONAL HR
“I OPT” STRATEGIC STYLE PROFILES

Graphic 6 plots the “I Opt” scores for various Traditional HR subunits—the flatter the curve, the greater the thought diversity. People within each of the categories use a roughly similar approach. Between these groups the approach varies. A HR Consultant (Group 1) might work with someone in Comp/Benefits (Group 3). Group 1 people are likely to offer speculative ideas and expedient solutions. People in Group3 will favor proven methods and exacting solutions. This consequence of thought diversity must be sorted out before an issue can be discharged.
Any staff has a degree of thought diversity. But HR is unique. Whatever HR is working on it is likely to involve people outside of HR. These people will probably pick up on the different positions among the HR components. The resultant inconsistencies tend to play out in the arena of the larger organization. Negative HR attributions are easy to make and are likely to be widely circulated.
Graphic 7
LEARNING AND DEVELOPMENT
“I OPT” STRATEGIC STYLE PROFILES

Graphic
7 shows the degree of variation between categories within L&D. The divergence of subgroups mirrors
Traditional HR. But Traditional HA tends to have a greater immediate impact on
external people. This creates a greater motive to highlight inconsistencies. Traditional HR is likely to be the subject of
higher levels of negative attribution.
Issues
embedded thought diversity tend to leak into culture. Culture is defined as
common beliefs, values and behaviors. Different “I Opt” profiles carry with
them expectations. These expectations translate into values. The values of the
staffs being managed affect local cultures and managerial strategies.
For
example, people holding high levels of LP are likely to view precision and
predictability as qualities to be prized.
People with high levels of idea oriented RI will likely see creativity
as a universal good. The strong HA will probably see analysis as the “right”
way to evaluate a situation—any situation. The RS is likely to view “let’s give
it a try” experimentation as the “true” way to validate matters. Words like
“right”, “true”, “always” and “universal” imply embedded values. With these
values comes a managerial headache.
The
challenge faced by the HR executive boils down to balance. Higher levels of
thought diversity make coordination more difficult. It weakens predictability. Different
positions need to be sorted out. Sorting
out takes both time and effort. These
factors all tend to compromise efficiency. Thought diversity is not free.
Offsetting
these costs are advantages. Thought diversity creates options and opportunities.
It also facilitates flexibility—there is usually someone around able to do any
particular job. HR has and is living in a period of change. Change creates new
needs. The positives associated with thought diversity can help HR address
changing conditions.
Why HR ranks
at the highest level of thought diversity is no accident. The nature of HR’s
diverse responsibilities launches the need. The variable nature of HR’s raw
material magnifies it. Finally the rapidly changing economic, social and legal
environments—all of which directly impact HR—make thought diversity a virtual
survival requirement.
MANAGING THOUGHT DIVERSITY
Every
staff has a level of thought diversity. HR is unique only in the fact that its
level is higher than others. The positive elements of HR’s higher level of
thought diversity are unlikely to be visible. HR’s ability to handle diverse
responsibilities and address unexpected situations will probably be invisible
to outsiders.
The negative elements probably stand out in
relief. Inconsistency, lessened predictability and less than ideal coordination
are likely to be enough to single it out for criticism—whether justified or
not. This result is embedded in the structure of the HR job.
An
earlier study (“Human Resources VP’s Seat at the Table”-
see #3 in footnotes) has
shown that HR Vice Presidents are as well-equipped as any other VP—with one
exception. They lack the ability to accurately predict outcomes. That study
argued that this condition was due to the lack of a metric that could be relied
upon. The earlier study offered one such metric. This study offers another.
This
new metric can enable HR executives to predict the dynamics in many situations.
Probable outcomes of these dynamics also become reasonably predictable (see #4 in footnotes). Cost-benefit calculations become
more accurate and reliable.
Predictability
also means that the likely outcome can be identified and rationally explained.
This can help align expectations. More
accurate expectations translate into fewer bases of stress and disagreement.
Transparency
becomes possible with the availability of a metric. Differences in judgement on
issues can be explained. For example, Comp & Benefits need for methodical
precision becomes obvious. The OD Consultant would probably still prefer a
“let’s give it a try” approach. But knowledge that the other position has a
rational foundation will at least temper unfavorable judgements.
Knowledge
of “who is what” also offers a framework for task allocation. An issue needing
creative options might be channeled to someone using higher levels of the RI
style. A person favoring HA thought pattern
might be channeled toward matters involving complex assessment. Each of the “I
Opt” styles has value that can be realized if applied to the right issues. Improperly
applied they can lead to both personal and organizational dysfunction.
Knowledge
of thought diversity provides a solid foundation for mutual respect. Fact-based
reasoning replaces emotional admonitions. Increased predictability limits
disjoints and disappointments. These are factors that can give rise to
unnecessary tensions and their dysfunctional companion behaviors. Knowing the
source of the condition and what it foretells opens the door for effective
managerial strategies to be applied within HR.
The “I Opt”
metric of thought diversity also offers the HR executive a vehicle for providing
definitive advice to other organizational units. Recommendations can be
articulated with precision. They can be justified with hard facts. Alternatives
can be weighed. The technology is universal. It can be applied anywhere and at
any level. It is a worthwhile tool to
keep in the organizational development toolbox.
FOOTNOTES
(1)
“Team Tension – Causes and Management”
video can be found in the Coffee Break Videos section of www.iopt.com or on
YouTube at http://www.youtube.com/watch?v=xQ_5b4BUUB0&feature=youtu.be.
A textual version can be found on our Google Research Blog at
http://garysalton.blogspot.com/2013/01/team-tension-causes-and-management.html
(2)
“Organizational Rank and Strategic
Style” video found in the Coffee Break Videos section of www.iopt.com or on
YouTube at http://www.youtube.com/watch?v=sqeGLvjU2Oc&feature=youtu.be.
A textual version can be found on our Google Research Blog at http://garysalton.blogspot.com/2012/10/organizational-rank-and-strategic-styles_22.html
(3)
“Human Resources VP’s Seat at the Table”
study can be found on our Google Research Blog at http://garysalton.blogspot.com/2007/01/human-resources-vps-seat-at-table_21.html.
(4)
“I
Opt” technology offers a variety of tools specifically designed to assess and
predict the likely functioning of groups. These include TeamAnalysis,
LeaderAnalysis and a host of other tools all of that incorporate thought
diversity as a central component of their analytical paradigm.