By: Gary J. Salton, Ph.D.
The question of whether males and females differ in their information processing profiles (i.e. strategic profiles) periodically arises. In other words, do males and females favor different approaches in addressing work situations?
The Organizational Engineering Institute maintains a database of Strategic Profiles obtained from “I Opt” Surveys (www.iopt.com). Gender is irrelevant to the “I Opt” process and thus is not explicitly available. However, people tend to designate their children using gender specific names. Mary reliably designates a female and John a male. This social convention allows the database to be divided into male and female components.
Prior research shows that different organization levels tend to favor particular strategic profiles (e.g., the CEO Insights blog or Dr. Ashley Fields doctoral dissertation). Thus an effective analysis requires that genders be analyzed within a common organizational range. Of particular interest are the higher organizational levels. These chart the course for the firm and thus affect the well being of everyone employed. Differences at this level could have a profound effect.
DATA
Executive level people were divided into two groups. The first are corporate level VPs. This includes “C” level executives (e.g., CFO, COO, CIO, etc.) but is not limited to them. It also captures VPs who head entire areas within a firm (e.g., a large geographic region).
The second group consists of the Director/Manager level people. This is the “middle management" of a firm. People in this group can head very large functions but share the characteristic of reporting to the Corporate VP level.
Within these groups gender was determined by reviewing the name of each person and assigning them to the male or female category. Names that did not clearly indicate gender were excluded. These included names like Chris, Pat, Willie, Dana, Shannon and similar entries. This culling process caused a loss of about 14% of the population.
Table 1
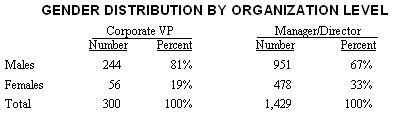
Table 1 shows the results of the categorization process. The data does not answer the question of why there is a proportional discrepancy between genders. It is probably due to a combination of causes. For example, people at the Corporate VP level probably began their careers in the 1960s and 1970s. A lower proportion of females entering a career tract in 1970 would translate into fewer female Corporate VPs today. In addition, these females had to overcome cultural barriers to advancement. In other words, the pioneering females of the 1970s and 1980s had a harder row to hoe than their male counterparts. This may have caused a disproportionate career casualty rate.
There may have been other factors. However, the situation seems to be trending toward equality. The 33% of females in the Director/Manager role will undoubtedly migrate to the Corporate VP level in future years. When they do, the proportion of female Corporate VPs will rise.
The roughly equal proportion of males and females in colleges today suggest that the process is continuing. People graduating today will be entering management ranks in 5 to 10 years. As they do a rough gender balance will begin to appear in the corporate hierarchy. The process is rather like environmental remediation. It takes time for native grasses to displace cultivated growth. It happens over time, not overnight.
The inevitability of the process is not at question. The real question is whether females are bringing with them an entirely different approach to organizational conduct. If they are it could foretell a fundamental shift in our business institutions. If they are not, it probably means a simple strengthening of our institutions. Making full use of an unused half of the human population would be bound to elevate the standards of the “average” executive.
GENDER SUMMARY
On an aggregate basis, the data suggest that a corner has been turned. The likely outcome is that the business institutions of American society will be strengthened as a result. There have been no “concessions” made at an information processing level for females entering the executive ranks. This means that more talent will be competing for high levels. The people “making the cut” are likely to be, on the average, of higher quality as a result of this more intense winnowing process.
Does this mean that there is no difference between males and females? Of course not. There are real gender differences in terms of physiology, chemistry and cultural factors among many other things. These differences are likely to cause a sensitivity to different variables than might be visible in a purely male hierarchy. However, those variables will be run through exactly the same process as a male would apply had they been sensitive to those variables.
This last factor could provide another basis for improvement of the American business institutions. These added variables are just as real and important as those visible to males. Introducing them into the equation is likely to produce outcomes that are even more completely optimized for the society to which they will be applied.
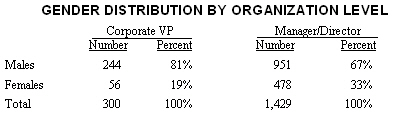
Table 1 shows the results of the categorization process. The data does not answer the question of why there is a proportional discrepancy between genders. It is probably due to a combination of causes. For example, people at the Corporate VP level probably began their careers in the 1960s and 1970s. A lower proportion of females entering a career tract in 1970 would translate into fewer female Corporate VPs today. In addition, these females had to overcome cultural barriers to advancement. In other words, the pioneering females of the 1970s and 1980s had a harder row to hoe than their male counterparts. This may have caused a disproportionate career casualty rate.
There may have been other factors. However, the situation seems to be trending toward equality. The 33% of females in the Director/Manager role will undoubtedly migrate to the Corporate VP level in future years. When they do, the proportion of female Corporate VPs will rise.
The roughly equal proportion of males and females in colleges today suggest that the process is continuing. People graduating today will be entering management ranks in 5 to 10 years. As they do a rough gender balance will begin to appear in the corporate hierarchy. The process is rather like environmental remediation. It takes time for native grasses to displace cultivated growth. It happens over time, not overnight.
The inevitability of the process is not at question. The real question is whether females are bringing with them an entirely different approach to organizational conduct. If they are it could foretell a fundamental shift in our business institutions. If they are not, it probably means a simple strengthening of our institutions. Making full use of an unused half of the human population would be bound to elevate the standards of the “average” executive.
GENDER AT THE CORPORATE VP LEVEL
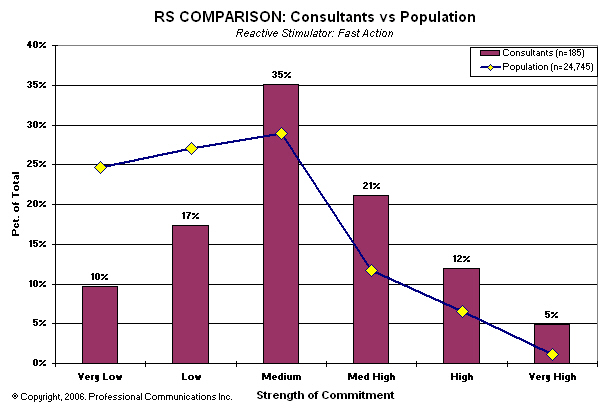
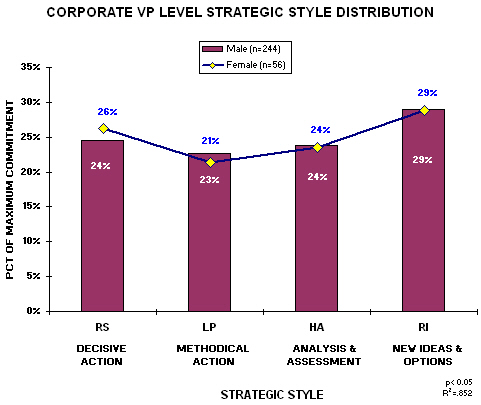
Graphic 1 shows the distribution of male and female Corporate VPs across all of the "I Opt" Strategic Style dimensions.
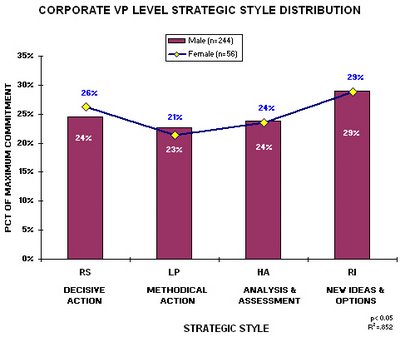 A glance at the profile of males and females suggests that both genders are virtually identical in their overall approach. A statistical test confirms that there is no significant difference between the genders. If there is a bias in hiring, retention and promotion it does not extend to the way issues are approached. On average, both genders are focused on gathering the same level of information (input), tend to issue the same kind of response (output) and engage the same steps (process) as their male counterparts (e.g., degree of risk, goals, use of power, etc.).
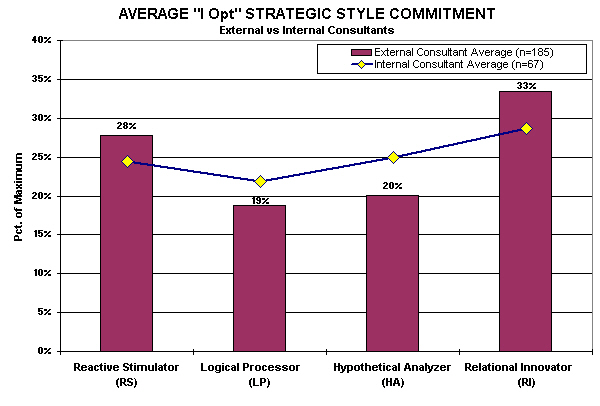
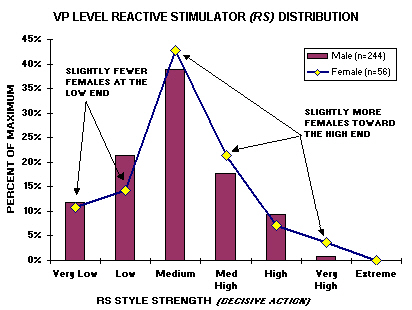
There are slight differences that do not rise to the level of statistical significance but are suggestive. One is the kind of action females at the top of firms are likely to take. Graphic 2 shows the distribution along the decisive (RS) and methodical (LP) action dimension.
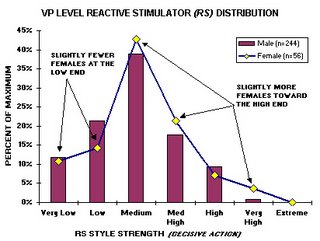
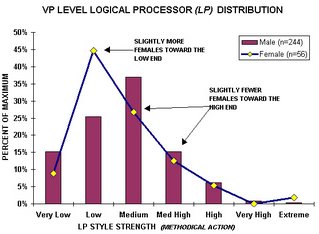 While certainly not definitive, it appears that there is a bit of a tendency for these pioneering females to adopt something of a forceful, quick paced posture (RS). They are also a bit less inclined to use a deliberate, careful and risk averse stance (LP). This posture, if it is "really" in the distribution, would serve to set them apart and probably help break through the glass ceilings in place during the 1970s and 1980s.
GENDER AT THE DIRECTOR/MANAGER LEVEL
Graphic 3 shows the strategic style distribution of “up and comers.” These people likely began their careers in the 1980s and 1990s. The females in this group benefited from the work of the pioneers who blazed the trail. The differences between genders are so small that percentages had to be expressed in tenths to distinguish them.
Graphic 1 shows the distribution of male and female Corporate VPs across all of the "I Opt" Strategic Style dimensions.
Graphic 1
 A glance at the profile of males and females suggests that both genders are virtually identical in their overall approach. A statistical test confirms that there is no significant difference between the genders. If there is a bias in hiring, retention and promotion it does not extend to the way issues are approached. On average, both genders are focused on gathering the same level of information (input), tend to issue the same kind of response (output) and engage the same steps (process) as their male counterparts (e.g., degree of risk, goals, use of power, etc.).
There are slight differences that do not rise to the level of statistical significance but are suggestive. One is the kind of action females at the top of firms are likely to take. Graphic 2 shows the distribution along the decisive (RS) and methodical (LP) action dimension.
Graphic 2
CORPORATE VP ACTION ORIENTATION
CORPORATE VP ACTION ORIENTATION
 While certainly not definitive, it appears that there is a bit of a tendency for these pioneering females to adopt something of a forceful, quick paced posture (RS). They are also a bit less inclined to use a deliberate, careful and risk averse stance (LP). This posture, if it is "really" in the distribution, would serve to set them apart and probably help break through the glass ceilings in place during the 1970s and 1980s.
GENDER AT THE DIRECTOR/MANAGER LEVEL
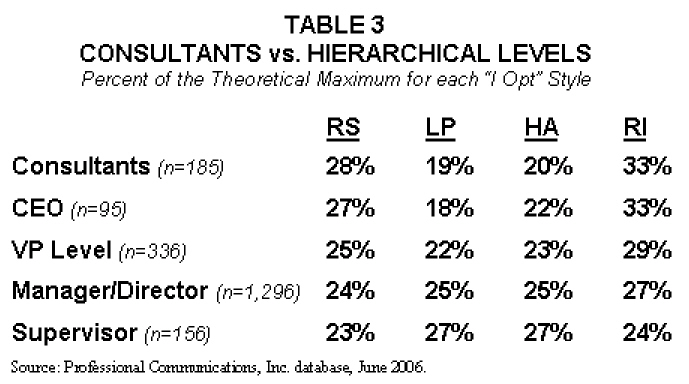
Graphic 3 shows the strategic style distribution of “up and comers.” These people likely began their careers in the 1980s and 1990s. The females in this group benefited from the work of the pioneers who blazed the trail. The differences between genders are so small that percentages had to be expressed in tenths to distinguish them.
Graphic 3
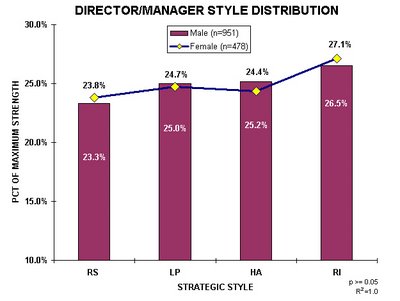
For all practical purposes the genders are indistinguishable. The correlation between the genders is 100%. At least in terms of the way the two groups approach the issues that they confront, there is no gender difference. Even more impressive is to look at the two groups in terms of the strength with which they subscribe to each individual style. This is shown in Graphic 4.
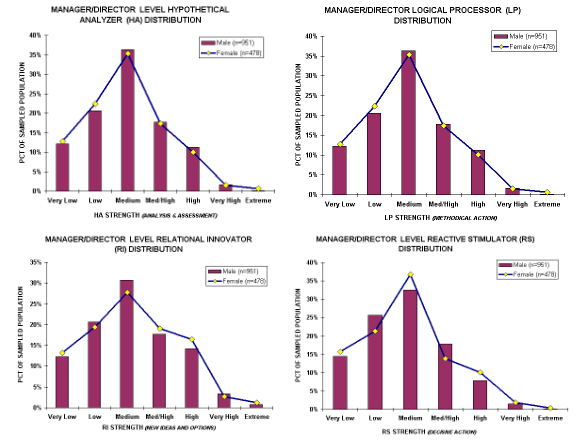
DIRECTOR/MANAGER STYLE STRENGTH DETAIL
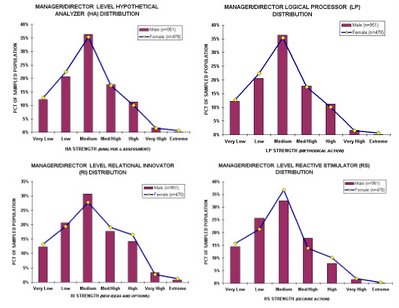 Not only are the averages virtually identical, but the distribution of style strength between the genders is identical. Literally as well as figuratively, corporations appear to be applying exactly the same criteria to males and females in terms of how they are expected to process the information that they use in the discharge of their responsibilities.

For all practical purposes the genders are indistinguishable. The correlation between the genders is 100%. At least in terms of the way the two groups approach the issues that they confront, there is no gender difference. Even more impressive is to look at the two groups in terms of the strength with which they subscribe to each individual style. This is shown in Graphic 4.
Graphic 4
 Not only are the averages virtually identical, but the distribution of style strength between the genders is identical. Literally as well as figuratively, corporations appear to be applying exactly the same criteria to males and females in terms of how they are expected to process the information that they use in the discharge of their responsibilities.
GENDER SUMMARY
On an aggregate basis, the data suggest that a corner has been turned. The likely outcome is that the business institutions of American society will be strengthened as a result. There have been no “concessions” made at an information processing level for females entering the executive ranks. This means that more talent will be competing for high levels. The people “making the cut” are likely to be, on the average, of higher quality as a result of this more intense winnowing process.
Does this mean that there is no difference between males and females? Of course not. There are real gender differences in terms of physiology, chemistry and cultural factors among many other things. These differences are likely to cause a sensitivity to different variables than might be visible in a purely male hierarchy. However, those variables will be run through exactly the same process as a male would apply had they been sensitive to those variables.
This last factor could provide another basis for improvement of the American business institutions. These added variables are just as real and important as those visible to males. Introducing them into the equation is likely to produce outcomes that are even more completely optimized for the society to which they will be applied.
This analysis was based on hard data. It was collected for other purposes and thus contains no collection or interview bias. The results of this analysis can probably be trusted.
“Vive la difference! Similitude de La de Viva!”
“Vive la difference! Similitude de La de Viva!”