Professional Communications, Inc. (PCI) has a large database that includes CEO "I Opt" scores. CEOs have been contrasted to other levels in the firm in earlier research blogs. This blog looks at how different CEO’s are from each other.
THE AVERAGE CEO
Graphic 1 shows the average of the 98 CEOs in the "I Opt" database. The average CEO's interest appears to center on producing creative options and on acting to secure them.
Graphic 1
 The average CEO’s RI (Relational Innovator) style is dominant. It is geared to plotting a course for the firm. The CEO seizes on new insights and explores what they might mean to the firm. How a new insight might fit into the business system is quickly outlined. A collegial atmosphere tends to surround the CEO when operating in this mode. The CEO is open to changes, modification and elaboration. A vision of what might be is being created.
Not every issue yields to the RI strategy. Even when it does, the creative process will sooner or later be exhausted. The CEO then shifts to their next most favored strategy, the Reactive Stimulator (RS). At this point talk is over. It is now the time to "do." The CEO's focus changes from what to do to when it will be done. Collegial give and take is replaced by authoritative direction. Milestones are set and commitments sought. Focused action is the CEO’s interest.
The world is not linear. Neither is the CEO's approach. They bounce back and forth between their preferred strategies. The combination catalyzes the adjustments the firm needs to navigate an ever-changing environment. The average CEO is a creative “doer.”
The “take home” from the above is that if you want to engage an average CEO, bring something creative to the table. Attach some kind of action proposal (RS) to it and be ready to move if it is accepted. Having some analytical HA material available explaining why a course has been selected is probably advisable but it should not be stressed. The least important thing is laying out exactly how things are to be done.
NON-PROFIT CEOs
Sixteen of the 98 CEOs in the "I Opt" database head non-profit or government (state and federal) agencies. Non-profits face more nebulous missions than firms in the profit-sector. There is no clear “bottom line.” Market feedback is slower and less clear-cut. These differences reflect themselves in the CEO’s profile as shown in Graphic 2.
Graphic 2
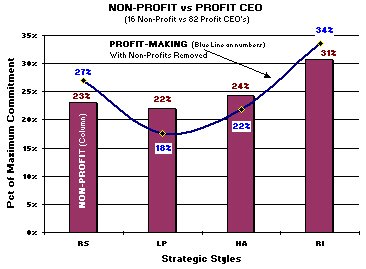 Non-profit CEOs favor the RI (creativity) strategic style but with a bit less intensity. Less defined goals make figuring out how a new idea “fits in” more difficult. A slower market feedback means less reliance can be placed on decisive action (RS). Too much damage can accumulate before a problem is known. In response the secondary strategy shifts to the analytical HA. Initiatives are more likely to be analyzed before being acted upon. Getting it done right is more important than being first to market.
All of the secondary strategies lie close together in strength. This is testimony to the nature of mission. The advantage of one strongly dominant secondary style is less clear cut. Like other CEOs the non-profit CEO is plotting a course in an uncertain environment. They are doing it more cautiously because they have to.
The “take home” from this mini-analysis is that the non-profit CEO can be engaged with creativity. However, the process of deciding what (if anything) to do will be longer. There simply are more things to consider. The balanced secondary styles mean that they may appear more “reasonable” than their profit-sector equivalents. They will seriously consider a wider range of proposals. The cost is elongated discussion and slower decisions.
Keep in mind this is mini-analysis is based on averages. There are non-profits with explicit goals and fast feedback. This means that there are non-profit CEOs who use strategic patterns similar to the profit-making sector. But these people will not be the typical non-profit CEO.
LARGE FIRM CEOs
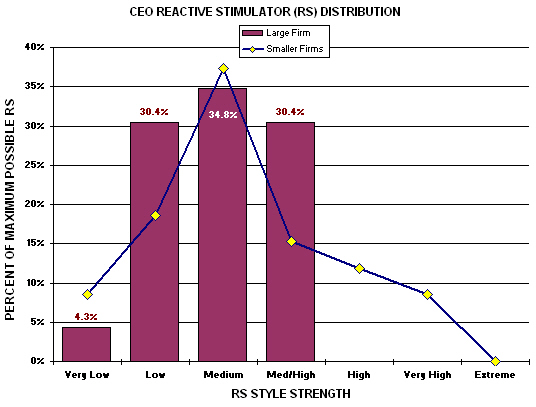
Larger firms tend to face complex issues and their decisions usually involve more stakeholders. The 82 profit-sector CEO’s in the database can be divided by size. Twenty-three have revenue of over $100 million. This should result in a different strategic profile—and on average it does.
Graphic 3
 Graph 3 shows the style distribution with the non-profits excluded. Large-firm CEOs appear less willing to take decisive action and more inclined to subject initiatives to analysis before acting. Graphic 4 shows that smaller firms are more likely to have CEOs who are prepared to act more aggressively. Large firm CEO's are also prepared to act but none occupy an extreme position. This reduces the overall RS average of large firm CEO shown above in Graphic 3.
Graphic 4
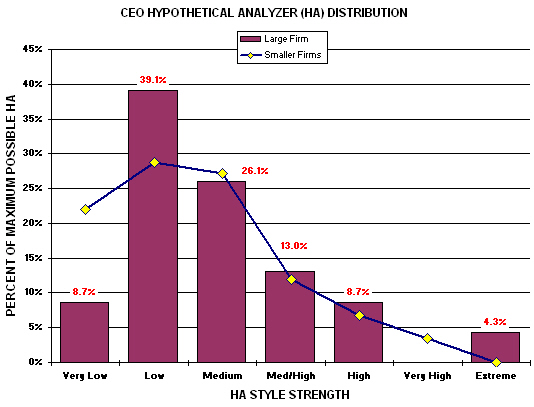
 The analytical HA offers a similar story but on the other side. Graphic 5 shows that the large firm CEOs are seldom found at the "very low" HA level. They have been shifted to the "low" level. This move has the effect of increasing the large firm CEO's average HA score. In other words, the higher overall HA is due to fewer people in the very low category rather than to more people in the higher ones.
Graphic 5
 The difference in large and smaller firm CEO profiles lies in the extremes. Large-firm CEOs are inclined to cluster in a band in the middle of the spectrum. It is likely due to the nature of the decisions being made. Complex decisions combined with multiple stakeholders probably favor moderate people in the CEO chair of larger firms.
Strategies that work for the CEOs of smaller firms are likely to be transportable to larger firms. The CEOs are equally interested in creative ideas. Their response to an initiative is likely to be more moderate but of the same character. In terms of decision-making information flows, what works at one CEO level will probably work at another.
BANTUM FIRM CEOs
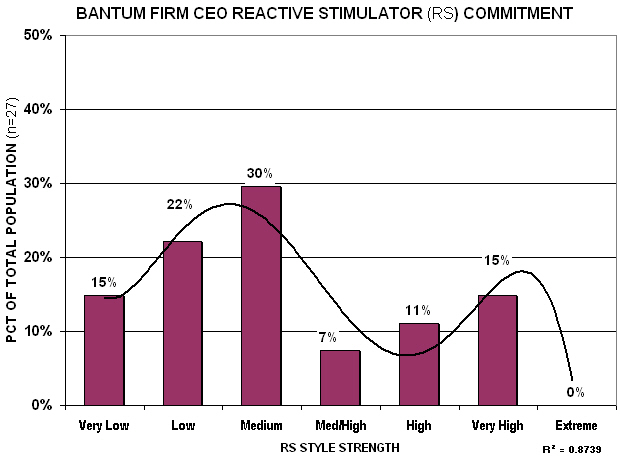
A 27-person segment of the profit-sector database consists of firms with less than $10 million in revenues. These firms live in a more precarious world. Their leaders might be expected to be sensitive to different information flows than their larger cousins. This is not the case.
Graphic 6
 The CEOs of the smallest firms look just like their larger brethren in terms of the structure of their information processing profile. They place highest value on creativity (RI) and are quick to action (RS). But there is a difference and it lies in the detail.
Graph 7 shows that the RS component is not linear. There seem to be two kinds of bantum firm CEOs. One set is relatively conservative in the use of decisive action. The other is aggressive. This may be due to the variety of different businesses (i.e., from janitorial firms to system integrators) in the sample. Or it may be that different strategies are equally viable. The charts do not answer this question.
Graphic 7
The CEOs of the smallest firms also put less stock in creativity (RI) than do both larger firm and non-profit CEO's. They average to about the same overall level. However, highly creative CEOs are more likely to be found in the bigger rather than smaller firms (see Graphic 8 "high" category). Thin resources may focus smaller firms on more certain strategies. Whatever the reason, it is less likely that a bantum firm CEO will be engaged by creative possibilities than will the CEOs of larger firms.
Graphic 8

The "take home" from this mini-analysis is that smallest firm CEOs are more variable than are their larger firm counterparts. Some will move VERY decisively but most will assume a more cautious posture. Creative options will be of some interest but are less likely to engage the bantum firm CEO.
SUMMARY
Graphic 9 shows an overall family resemblance among CEOs of all types. The non-profit CEO is most unique but still echoes of the profit-sector CEO profile.
Graphic 9
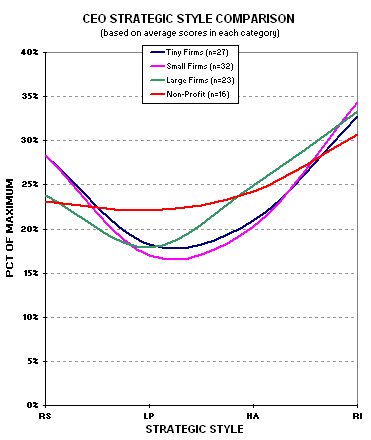 The reason for the similarity probably lays in the common role the CEOs fill in any organization. Their job is navigating the future. Standard practices and existing methods are in the competent hands of others. The CEO role is to identify opportunities for meeting the conditions of a business environment that does not yet exist. The creative RI strategy is best suited for that purpose. It is likely that CEOs either develop or are selected for their strength in this area.
Once a course has been plotted the CEO role is to cause the firm to follow it. This responsibility is best served by the decisive and action oriented RS style. The posture is tempered in the case of large and non-profit CEOs in favor of the analytical HA style. It is likely that the most important factor in this shift is the influence of stakeholders. The absolute magnitude of decisions attracts and motivates the large firm CEO's stakeholders. Satisfying this wider mix of interests likely results in a more tempered posture.
The more nebulous mission of the non-profits has the same effect. Here stakeholders probably attempt to "bend" decisions in favor of their own interests. Without a definitive "bottom line," analysis (HA) is the only tool available for sorting out the interests' relative to the issues.
Smaller firm CEO's in the profit-sector are the least restricted of the group. They have fewer stakeholders. This means that the decisive RS will be evidenced in visible behavior more quickly. The level of creative RI may be less pronounced (in terms of distribution) but will be visible faster. Hence the smaller firms will be seen as being more nimble and more creative than their larger-firm counterparts.