Chief: Research and Development
Professional Communications, Inc.
ABSTRACT
Multiple studies (#1 in Footnotes) show that strategic styles vary by rank for mid to high level management. This study used a sample of 10,617 individuals from 1,559 different organizations to confirm and extend these findings for the entire range of management from first level supervision to CEO. It then isolates a single cause for the patterns seen in the real world data.
The second phase of the study is a stress test that applies the macro level findings to first level management. That sample consisted of 1,801 individuals from 390 different organizations who held five different titles but who occupy roughly the same hierarchical level. It was found that the same factor causing the pattern regularity at the global level also applied within first level management.
The factor responsible for the consistent relationships was found to be an organizational constant. It is inherent in the nature of organizations. Its effects can be relied upon. They will apply to any organization. They will occur in any culture. They are independent of time and will as applicable in 1,000 years as they are today.
 |
| Click here to link to YouTube |
THE SAMPLE
The sample consists of 10,617 people from 1,559 different organizations. The size and diversity of this sample is shown in Table 1 (#2 in Footnotes for title consolidation statistics).
Table 1
SAMPLE SIZE AND DISTRIBUTION

Table 2 (below) shows the distribution of the sample across economic sectors. The sample includes representatives from all major areas of the economy.
Table 2
SAMPLE DISTRIBUTION ACROSS ECONOMIC SECTORS

The sample is of sufficient size and diversity to warrant its acceptance as reasonably representative of the various hierarchical levels. It can probably be trusted.
ORGANIZATION LEVEL RESULTS
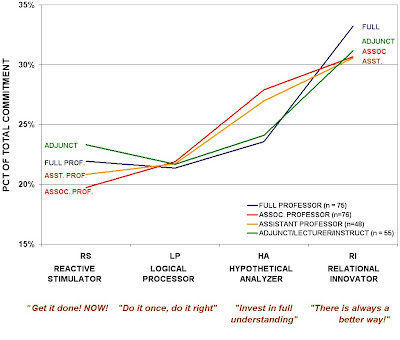
Graphic 1 (below) shows the average management “I Opt” scores from first level management to CEO. A glance at the chart is enough to suggest that something systematic is going on. The raw numbers do not fluctuate randomly but appear to be following some kind of trend line based on hierarchical level. One way to assess what is happening is to find a common denominator between the lines that are increasing and those that are decreasing in strength.
Graphic 1 (below) shows the average management “I Opt” scores from first level management to CEO. A glance at the chart is enough to suggest that something systematic is going on. The raw numbers do not fluctuate randomly but appear to be following some kind of trend line based on hierarchical level. One way to assess what is happening is to find a common denominator between the lines that are increasing and those that are decreasing in strength.
Graphic 1
“I OPT” SCORES BY MANAGEMENT LEVEL


That common denominator is the input strategy. The two red lines, the Logical Processor (LP) and Hypothetical Analyzer (HA), share a structured approach. Both styles seek out particular information inputs using some kind of template, plan or scheme that they believe will successfully address the issue at hand. For example, the analytical HA may use math and logic (both well-defined methods) to create a plan. The action oriented LP may select a particular procedure to remedy a condition being confronted. Both the HA’s methods and the LP’s processes guide them to select particular kinds of inputs and to reject others.
The two blue lines, the idea generating Relational Innovator (RI) and quick acting Reactive Stimulator (RS), share an unpatterned strategy. Both use an opportunistic approach to information. They are both likely to accept any kind of input that looks like it might address the issue that they confront. This somewhat random process is managed by a culling strategy. Both styles are quick to discard things that do not work. The net result is to quickly isolate solutions that are adequate rather than optimal. Speed is traded for perfection. The assumption is that if improvement is warranted, the item can be returned to later for refinement. Efficiency is sacrificed for quicker implementation.
It is worth noting that both sets of lines, those going up and down, contain both thought (HA and RI) and action (LP and RS) components. The purpose of thought is to guide action. The purpose of action is to affect the external world (“I Opt” theory differentiates action from activity). Thus both pairs of lines contain the basic components necessary to navigate life.
“I Opt” styles are exercised within an environment. That environment can cause one or another style to be favored as a means of navigation. A major part of the environment in an organization is hierarchical rank. Graphic 2 divides raw data graph into hierarchical zones.
Graphic 2
“I OPT” SCORES DIVIDED BY MANAGEMENT LEVEL
The various first level management titles are grouped into a single category because they share an operational orientation. Their defining attribute is a focus on near-term outcomes and the clarity of the influences affecting the matter at hand. The variables required by the structure (i.e., method, procedure, etc.) are available, their relationships are typically well understood and there is a certain regularity in the kinds of issues being addressed. The value of the structured approaches of both thought (HA) and action (LP) are maximized under these conditions.
Graphic 3
MANAGEMENT LEVEL ORIENTATION
Graphic 3 (above) illustrates the changing focus of the job as you ascend the hierarchy. At the manager level the critical success factor shifts from operations to tactics. Tactics typically involve responses to changing situations that preserve or better the circumstances of the unit being managed. A changing situation implies that new factors enter into decisions. With these new factors come unexpected relationships that must be accommodated. The pattern regularity required by any structured approach is diminished. The value of the LP and HA style declines and that of the RI and RS rises.
At the Vice President level the focus shifts from tactics to strategy. Strategy is typically a general plan that attempts to proactively create favorable future situations. To be effective, strategy must extend farther into the future than do tactics. The farther into the future a decision reaches, the more likely it is that unforeseen factors will intervene to disrupt expectations. Pattern regularity declines still further and with it the value of the HA and LP styles.
At the CEO level emphasis changes from strategy to mission. Mission concerns the ultimate goals of the organization that focus the various tactics and strategies into a coherent direction. Uncertainty compounds as time horizons move to 5, 10 or even 20 years into the future. The value of the structured styles declines still further.
Another factor accelerating the decline in LP and HA value at upper management levels is resolution. Resolution refers to the clarity with which the variables involved in a decision are recognized and assessed.
Responsibilities broaden with a rise in hierarchical level. Multiple interests demand attention and distance from day-to-day activity increases. Any scheme, plan or method being used requires that all of its component elements be available. If the particulars needed by a structured approach are weakened or lost the value of a methodical, deliberate strategy (i.e., LP and HA) necessarily declines. The loss of resolution causes the needed information to be unavailable at higher levels.
The two factors of increasing uncertainty and decreasing resolution explain the drop in the use of structured styles with higher organizational position. The fast acting RS and idea oriented RI move to fill the gap. The question is why?
The answer to the question lies in the same cause but working through a different agency. At the operating level tightly interdependent processes dominate. Any new ideas or quick fix options must be “fit” into the process in detail. This limits the opportunity for RI or RS options. In addition, the interdependent nature of the operations heighten the probability of failure cascades. This risk offsets the gain promised by the intervention. The combination of less opportunity and poor incentives keeps the RI and RS style commitment low at operating levels.
The processes in play loosen as you ascend the hierarchy. This reduces the perceived risk of cascading failure. Less risk increases the net gain promised by an intervention. In addition, uncertainty creates a gap in knowledge that invites opportunity. New ideas, options and alternatives can be seen as offsetting or even leveraging existing uncertainty. These factors act to increase the value of the unpatterned strategies of RI and RS.
Still another factor encouraging opportunity and incentive is resolution. The farther you move from operations, the less vivid are the details that might inject themselves to frustrate an innovative proposal or action. With fewer factors to consider, the opportunity for new initiatives increase and with them the value of the RI and RS strategies.
Graphic 4
CORE FACTOR ILLUSTRATION

Graphic 4 (above) illustrates the relationship of uncertainty, resolution, opportunity and incentive to a single underlying variable, predictability. The more predictable a process or method, the greater the value of structured strategies. Lessening predictability creates opportunity and incentive for new, untested initiatives that are the forte of the unpatterned approaches.
An importantly quality of predictability in this context is that it is inherent in the very structure of the organization. Resolution will always diminish with distance. Uncertainty will always increase with lengthening horizons. Opportunity and incentive will always increase as predictability falls. It does not matter how anyone “feels” about it. Geographic location does not matter. Culture does not matter. Time does not matter—these findings will apply today, tomorrow and 1,000 years from now. Predictability will always drive the distribution of styles in an organization toward the type of configuration seen in this sample.
An importantly quality of predictability in this context is that it is inherent in the very structure of the organization. Resolution will always diminish with distance. Uncertainty will always increase with lengthening horizons. Opportunity and incentive will always increase as predictability falls. It does not matter how anyone “feels” about it. Geographic location does not matter. Culture does not matter. Time does not matter—these findings will apply today, tomorrow and 1,000 years from now. Predictability will always drive the distribution of styles in an organization toward the type of configuration seen in this sample.
THE GENIUS OF THE CURVES
Graphic 5 (below) shows that the rank order of “I Opt” strategic styles essentially reverse position between the bottom and top of an organization.
Graphic 5 (below) shows that the rank order of “I Opt” strategic styles essentially reverse position between the bottom and top of an organization.
Graphic 5
RANK ORDER OF STRATEGIC STYLES

For an organization to persist in a particular environment it must attend to the present and the future. The lower end of the organization tends to the particulars needed for immediate survival. The upper end must plot a course toward a favorable future position. Both of these needs must be satisfied in a way that one end of the organization does not confound the other. Therein lies the genius of the curves.
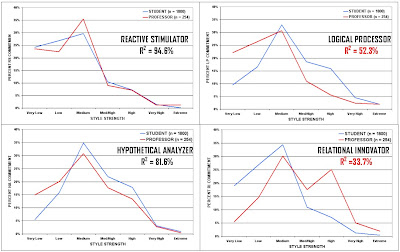
The nature of the threads linking the top and bottom of the organization are best seen by smoothing the raw data using trend lines. The Coefficient of Determination (RSquared) for the trend lines ranges from 92% to 98% indicating that the distortion introduced by this smoothing is minimal (#3 in footnotes). In other words, the “fit” of the trend line to the actual data is highly accurate. Graphic 6 (below) shows the results (the very faint gray lines in the background are the actual raw data).
The nature of the threads linking the top and bottom of the organization are best seen by smoothing the raw data using trend lines. The Coefficient of Determination (RSquared) for the trend lines ranges from 92% to 98% indicating that the distortion introduced by this smoothing is minimal (#3 in footnotes). In other words, the “fit” of the trend line to the actual data is highly accurate. Graphic 6 (below) shows the results (the very faint gray lines in the background are the actual raw data).
Graphic 6
STRATEGIC STYLE TREND LINE DISTRIBUTION

The “take home” from Graphic 6 is that adjacent titles lie within reasonable proximity to each other. The occupants of these adjacent titles are different enough to expand each others perspectives. They are similar enough to interact without encountering major communication problems (e.g., level of detail, risk tolerances, timing expectations, etc.). The intermediate titles act as a bridge between the diametrically opposite style preferences at both extremes of the organization.
Graphic 6 shows that the predictability which drives the use of structured and unpatterned styles does so in an incremental manner. There are no sudden jumps or dramatic plunges. Predictability appears to be a continuum with infinite gradations. This not only provides a path for organizational design but may also be of value in transitioning between the various titles. It is a useful insight.
Graphic 6 shows that the predictability which drives the use of structured and unpatterned styles does so in an incremental manner. There are no sudden jumps or dramatic plunges. Predictability appears to be a continuum with infinite gradations. This not only provides a path for organizational design but may also be of value in transitioning between the various titles. It is a useful insight.
A FIRST LEVEL MANAGEMENT STRESS TEST
The first level management category used in the foregoing analysis includes multiple titles, all of which occupied roughly the same hierarchical position. If predictability is the factor driving organizational design, its effects should be seen in any differences between the first level titles.
The first level management category used in the foregoing analysis includes multiple titles, all of which occupied roughly the same hierarchical position. If predictability is the factor driving organizational design, its effects should be seen in any differences between the first level titles.
Table 3
FIRST LEVEL MANAGEMENT
SAMPLE SIZE AND DISTRIBUTION

SAMPLE DISTRIBUTION BY ECONOMIC SECTOR
SAMPLE SIZE AND DISTRIBUTION

Table 3 (above) shows the sample segment for first level management consists of 1,801 individuals from 390 unique organizations grouped into five title categories (#4 in Footnotes for detail on coordinators). Table 4 (below) shows that the sample is drawn from a cross section of economic sectors.
Table 4
FIRST LEVEL MANAGEMENT SAMPLE DISTRIBUTION BY ECONOMIC SECTOR

Statistically, the size and diversity of the sample is enough to allow it to be considered representative of first level management.
Graphic 7 (below) highlights the mean (i.e., average) scores of each of the “I Opt” styles plotted with their associated first level job titles. The trends embedded in the lines suggest that an underlying “something” is at work.
Graphic 7 (below) highlights the mean (i.e., average) scores of each of the “I Opt” styles plotted with their associated first level job titles. The trends embedded in the lines suggest that an underlying “something” is at work.
Graphic 7
FIRST LEVEL MANAGEMENT
STRATEGIC STYLE COMMITMENT BY JOB CATEGORY
STRATEGIC STYLE COMMITMENT BY JOB CATEGORY

The trends displayed by the raw data show the same tendencies that are seen at the macro level. But they are less pronounced and occur between some, rather than all, of the first level job titles. Therefore the first task becomes to try to determine if the titles describe real differences in approach. And the way to test that is to statistically compare each first level title against all of the others. Table 5 (below) presents the findings of that test.
Table 5
FIRST LEVEL MANAGEMENT
STATISTICAL SIGNIFICANCE TESTS (a)
STATISTICAL SIGNIFICANCE TESTS (a)

The academic standard for declaring changes in style scores to be “significant” is 5% or less (i.e., there is less than a 5% chance that the difference in scores is due to pure chance). In statistics “significant” does not mean that the differences are material. It just means that they are probably not chance variations. The boxed numbers in yellow identify differences that meet the academic 5% significance standard. Significance scores are not scattered but tend to “bundle” adjacent titles.
Graphic 8
FIRST LEVEL MANAGEMENT
STRATEGIC STYLE JOB GROUPINGS

Graphic 8 (above) converts the significance table to visual form. It reveals two distinct “bundles” (circled). The differences within each circle (i.e., bundle) appear to be random variations. But the differences between the bundles are statistically significant. Graphic 8 tells us that lower management divides into two distinct groups along the action dimension of LP and RS.
The foundation for the differences appears to rest on the things being managed. Supervisors, Assistant Managers and Coordinators in Group 1 are all involved in guiding relatively stable ongoing processes. Stable processes mean there is less need for a spontaneous, “let’s give it a try” RS approach.
The situation changes in Group #2. Project managers and team leaders address identifiable tasks that have an end point. They are event oriented. The path toward achieving the goal is less well defined. This lessens the value of the disciplined LP strategy. The responsive RS rises in value with the increased probability of unexpected issues.
Predictability again appears to lie at the core of the difference in approaches. The predictability of structured processes offer the opportunity to design optimal strategies for managing those stable processes. The lessened predictability of event driven activities makes spontaneous responses more viable. The shift in the action options between LP and RS make sense.
The plot of the idea-oriented RI style in Graphic 9 (below) is again enough to suggest that some kind of cause is in operation. The scores for titles falling within the dotted green ellipse (#2 through #4) do not differ significantly from each other. That means that there are three distinct levels of RI commitment within lower management—Supervisor, Leader and titles falling in the green ellipse. The question is why?
Graphic 9
FIRST LEVEL MANAGEMENT
RELATIONAL INNOVATOR (RI) AVERAGES AND TREND

The answer appears to lie in the effect of predictability on opportunity and incentive. The Supervisor’s stable, established processes leave little room or reason for new approaches. Thus the low RI style. For leaders at the other end of the graph there are no tightly defined processes to interrupt. Unforeseen exposures and unexpected situations create both incentive and opportunity for new ideas and approaches. Hence appreciably higher RI commitment. Titles lying between these extremes simply face varying degrees of opportunity and incentive (#5 in Footnotes).
The last of the first level “I Opt” styles to be considered is the analytical HA. Unlike the other styles, the average commitment to the Hypothetical Analyzer (HA) style varies by less than one percentage point. Graphic 10 (below) shows a trend line that is virtually flat. So, why is not this style responding to the predictability change seen in the other styles?
The last of the first level “I Opt” styles to be considered is the analytical HA. Unlike the other styles, the average commitment to the Hypothetical Analyzer (HA) style varies by less than one percentage point. Graphic 10 (below) shows a trend line that is virtually flat. So, why is not this style responding to the predictability change seen in the other styles?
Graphic 10
FIRST LEVEL MANAGEMENT
HYPOTHETICAL ANALYZER (HA) AVERAGES AND TREND

The answer lies in the thought based methods of the HA. Tools like “what if” analysis and Monte Carlo techniques allow the HA to handle uncertainty within the bounded range characteristic of first level management activities. In addition, the near-term nature of first level activities means that resolution remains high.
The combination of bounded uncertainty and high resolution means that the HA strategy remains valuable throughout the range of first level activities. It is only at the manager level where tactical demands limit the time available for analysis and uncertainty takes on a more unbounded character that the commitment to the HA strategy begins to decline.
The results of the first level management analysis confirm what was found at the macro level. Again, predictability working through the agencies of uncertainty, resolution, opportunity and incentive explains the results produced by actual firms operating in the real world. Predictability simply exercises these agencies through the filter of job content rather than through the more general filter of horizon. While not demonstrated in this study, it is likely that job content controls the distribution of styles within any specific organizational level. In any event, predictability remains the core cause of the observed phenomenon.
SUMMARY
This research has uncovered a constant that is embedded in the very nature of organizations—predictability. Predictability works through the agencies of uncertainty, resolution, opportunity and incentive. These vary by horizon across the hierarchy and by job content within specific levels (e.g., first level management).
Any enduring organization faces an array of conditions that simultaneously involve different levels of predictability. It must manage these conditions in such a way that the actions of one part of the organization do not confound those in another. The study revealed that this is accomplished by moderate degrees of difference between adjacent levels. These intermediate level styles act as linked “boxes” connecting the extremes. The system is a unique transmission mechanism. It not only “transmits” information up and down but also changes the “gearing.” The meaning of the information being transmitted is adjusted to be appropriate for each level.
The ability to attach a “why” to the findings is of practical significance. It gives confidence that the relationships discovered are “built into” the system. The combination of hard data and strong logic gives confidence that the findings are not just another fad. Scholars and professionals can rely on these results in designing and developing tools, methods and strategies for improving the performance of organizations in field settings.
BIBLIOGRAPHY/FOOTNOTES
(1) Salton, Gary (Various Organizational Engineering Evidence-Based Research Blogs) including:
Salton, Gary (November 2010) Sales Management and Performance. http://garysalton.blogspot.com/2010/11/sales-management-and-performance.html
Salton, Gary (October 2010) City Management
http://garysalton.blogspot.com/2010/10/city-versus-corporate-executive.html
Salton, Gary (September 2009). The Nursing Staircase and Managerial Gap
http://garysalton.blogspot.com/2009/09/nursing-staircase-and-managerial-gap.html
Salton, Gary (September 2008). Hierarchy Influence on Team Leadership
http://garysalton.blogspot.com/2008/09/hierarchy-influence-on-team-leadership.html
Salton, Gary (August 2008). Engineering Leadership.
http://garysalton.blogspot.com/2008/08/engineering-leadership.html
Salton, Gary (June 2008). The Pastor as a Leader.
http://garysalton.blogspot.com/2008/06/pastor-as-leader.html
Salton, Gary (May 2008). Fitting the Leader to the Matrix
http://garysalton.blogspot.com/2008_05_01_archive.html
Salton, Gary (October 2007). Leadership, Diversity and the Goldilocks Zone
http://garysalton.blogspot.com/2008_01_01_archive.html
Salton, Gary (October 2007). How Styles Affect Promotion Potential
http://garysalton.blogspot.com/2007_10_01_archive.html
Salton, Gary (November 2006). Gender in the Executive Suite
http://garysalton.blogspot.com/2006_11_01_archive.html
Salton, Gary (October 2006). CEO Insights
http://garysalton.blogspot.com/2006_10_01_archive.html
(2) The study tested whether Project and Program Managers are distinct in the way they approach decision issues. The results of the analysis were:
PROJECT VERSUS PROGRAM MANAGER

The same tests were done on the Assistant Manager and Assistant Vice President (AVP) to determine if they warranted distinct categorical designations.
ASSISTANT MANAGER VERSUS ASSISTANT VICE PRESIDENT

The above tables show that both Project and Program Managers as well as Assistant Managers and AVPs are likely to seek out the same kinds of information, weight it in similar fashion, have roughly the same risk tolerance and so on. The differences in their “I Opt” scores are the result of random variation around a common mean. This means that both sets of titles can reasonably be considered to be single job categories. Thus the titles Project and Program manager are combined for this analysis as are Assistant Manager and AVP.
(3) The fit of the trend lines to actual data were tested to insure that they did not distort the meaning of the data. The fit statistics are:
The trend line for the RS was a second degree polynomial with an R2 of 0.9562.
The trend line for the RI was linear regression with an R2 of 0.9202
The trend line of the LP was linear regression with an R2 of 0.9642
The trend line for the HA was a second degree polynomial with an R2 of 0. 9826.
The trend line for the RS was a second degree polynomial with an R2 of 0.9562.
The trend line for the RI was linear regression with an R2 of 0.9202
The trend line of the LP was linear regression with an R2 of 0.9642
The trend line for the HA was a second degree polynomial with an R2 of 0. 9826.
(4) Coordinators were included in first level management since they hold some authority to synchronize or otherwise to cause adjustments in the activities being coordinated. This authority is functional management whether or not they are accorded hierarchical recognition in a particular organization.


