Monday, June 18, 2012

Secrets of the Administrative Assistant

By: Gary J. Salton, Ph.D.
Chief: Research and Development
Professional Communications, Inc.


SUMMARY
Click here to Link to YouTube
This research is based on a 194-person sample from 100 different organizations.  The research demonstrates the centrality of the Administrative Assistant's role by contrasting it with over 5,000 people in other professional and managerial roles. Behavioral stances that are not readily visible (i.e., secrets) are shown to be derivative by-products of the processes required by the basic Administrative Assistant function.
A companion video both abbreviates and expands this research.  It can be viewed on www.iopt or by clicking the icon on the right to directly access the YouTube video.


THE JOB
The importance of Administrative Assistant is reflected in its prevalence. The US Government identifies this category as “among those with the largest number of job openings” (1).  The duties generating this level of demand are varied. They typically include activities such as:

     1. Controlling and directing access
(e.g., telephone, visitor, etc.)
     2. Ensuring that material is available when needed
(i.e., inventory control)
     3. Sourcing suppliers and processing invoices for payment
(vendor relations)
     4. Preparing/directing internal communications
     5. Scheduling and coordination
(e.g., meetings, events, etc.)
     6. Preparing material for distribution
(e.g., letters, memos, reports, packages, etc.)
     7. Compiling data and performing preliminary analysis
     8. Maintaining records for later use in analysis and/or validation
(e.g., audit)

The list is not exhaustive but it is indicative. It describes both a “gatekeeper” and a conduit function.  In both roles interest centers on the control of inputs
(broadly defined) to the organization.

 
THE SAMPLE
The data from 194 Administrative Assistants were drawn from 100 unique organizations. Table 1 shows the geographic distribution of the sample.

Table 1
GEOGRAPHIC DISTRIBUTION OF ADMINISTRATIVE ASSISTANTS 

The sample size is reasonably representative of Administrative Assistants within the United States. Possible cultural differences suggest that caution be used in applying the results outside of that context.

The sample titles had a variety of names attached to Administrative Assistant role
(e.g., executive assistant, secretary, etc).  These were tested statistically. It was found that all shared the same basic approach.  This suggested a reasonable commonality in job content.

The sample also included Administrative Assistants from educational institutions, non-profits and for-profit firms.  The study statistically tested whether the function differed by the sector in which it was practiced.  No statistically significant difference was found. In other words the role appears to be the same regardless of where it is practiced (see Statistical Appendix 2 for detail).

The sample size, wide range of organizations sampled and the consistency across titles and employment sectors strongly suggest that the 194-person sample is reasonably representative of the Administrative Assistant function as a whole.


DISTRIBUTION OF "I OPT" STYLE STRENGTH
The “I Opt” profile describes the information processing strategy being used.  The profile for Administrative Assistants is displayed in Graphic 1. It shows a heavy reliance on the disciplined LP and analytical HA strategic styles.
Graphic 1
ADMINISTRATIVE ASSISTANT AVERAGE
STYLE STRENGTH DISTRIBUTION
Averages are part of the story.  The style strength distribution that makes up that average is another.  Graphic 2 (below) shows that the profile is not the result of a few outliers pulling the average up.  Rather, the high commitment to both the action (LP) and thought-based (HA) styles is widespread. Both of these strategies focus on an exacting, precise work product. 

Graphic 2
ADMINISTRATIVE ASSISTANT DISTRIBUTION
OF STRUCTURED STYLES
Graphic 3 (below) tells the same story. Unpatterned (i.e., spontaneous) input strategies are concentrated at the lower end of commitment. Little value is being placed on the RS’s impulsive, “let’s give it a try” approach or the RI’s speculative ideas and options. 
Graphic 3
ADMINISTRATIVE ASSISTANT DISTRIBUTION
OF UNPATTERNED STYLES
The overall “I Opt” profile makes some sense. Admins serve a mix of people with different needs and preferences. Dependable and exacting performance is likely to be reasonably acceptable to everyone.  The same cannot be said about the somewhat impulsive RS or the sometimes-fanciful ideas of the RI. High levels of LP and HA style appear to be a job requirement.

Table 2
(see #2 in footnotes for detail on roles) shows that the job is unique. It shows the strength of commitment to each “I Opt” style of various roles in rank order.  The Admin is at the top in their commitment to the disciplined LP and HA styles.  They are at the bottom in their use of the spontaneous RS and RI styles. This kind of consistent positioning is no accident.
Table 2
ROLE RELIANCE ON DIFFERENT
STRATEGIC STYLES
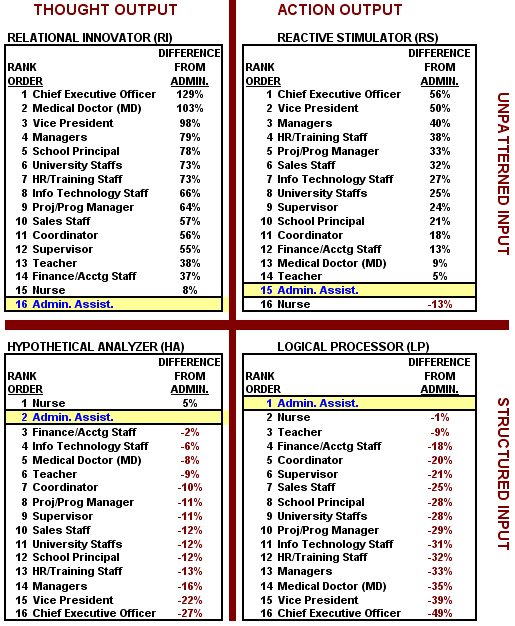
 
The same phenomenon can be seen in another job that occupies an extreme position, the CEO. Where the Administrative Assistant is highly committed to a style, the CEO is low and vice-versa. The reason that these jobs lie at the extremes of the range follows from their nature.

The CEO sets a course into an unknown future. There are no “facts” for things that have not yet occurred.  Established processes that depend on “facts” lose their applicability.  Similarly entrenched structures that rely on existing patterns or systems are inherently vulnerable over long horizons (e.g., smartphones, biotech, nano technology, etc.). The average CEO has no choice but to emphasize the unpatterned strategies of RI and RS which do not depend on facts or established systems to operate effectively.

The Admin is in the same position, just in reverse. They must comply with established practices of external agencies to provide needed inputs (e.g., supplies, maintenance schedules, etc.). In addition, others can set the Admin’s activities and priorities.  With the task being prescribed by others the use of the personally spontaneous RS and RI strategies automatically limited.

People in the middle of the organization are able to use a wider mix of strategies than either the CEO or Admin.  This creates the “I Opt” profile gap shown in Table 2. The greater the percent difference (up or down), the more likely it is that the people will be “seeing” issues in different terms. A different perspective can easily lead to different views on what should be done .

People tend to see issues in light of their own responsibilities. They are likely to judge others based on the criteria appropriate to their favored strategy. The RS is likely to emphasize speed, the RI creativity, the HA understanding and the LP precision.  Everybody, including the Admin, tends to believe that they know the “right” way of doing things.  And the natural tendency is to help others to “see the light.”   Tensions can easily follow if that effort is unsuccessful
(see Appendix 1 for an outlier case where style similarity rather than difference can breed tensions).

All of the different style preferences are needed in one place or another. This means that tensions are embedded in the nature of organizations. Understanding their source reduces their “sting” since it tends to discount any malicious motive on the part of a transgressor.

Methods for handling organizational tensions are beyond the scope of this article.  However, an obvious strategy is to avoid situations where vulnerabilities are likely to be highlighted and pursue situations where strengths are likely to be displayed.  Another obvious strategy is to diffuse tensions using the “language” of the other person. For example, the LP can adopt emotional displays (e.g., emphasis in voice, arm movement, intense posture, etc.) when trying to “get through” to an instant action RS. Conversely, the RS may want to adopt a calm, measured and undemonstrative stance when trying to “reason” with the methodical LP. The same logic applies to all other styles.

The take-home from this research is that nobody is dumb.  Nobody is broken. There are just things that need to be managed. For the Administrative Assistant this might begin with identifying the “secrets” that flow from their strategic choices.

THE SECRETS
Like all strategies, the Admin’s LP and HA preferences produce by-products.  These are simply the natural consequences of the practices being used to get the job done. Because these are secondary or derivative behaviors they are often unrecognized until they become visible as a result of a transgression or particular circumstance.  This obscurity qualifies them to be framed as “secrets.” 
 
In dealing with the average Administrative Assistant other members of the organization may want to keep in mind some of these secrets (see #3 in footnotes for reference to a more complete enumeration).


  1. The average Admin can generate and accept change but it has to be on their terms. There must be time to consider and work it in, it must be specified thoroughly and preferably should be incremental in character.  In other words, the changes must “fit in” with the other things being done. This is a direct offshoot of the Admin's prized precision and dependability qualities.
     
  2. An Admin can be overwhelmed. Their strength is that they can handle massive amounts of detail. Their vulnerability is that this capacity has limits.  When that capacity is hit, an LP can “freeze up.” This can cause considerable stress as well as compromising performance. Resist “piling things on” because the Admin looks like they can handle even more.  Sometimes they can’t.
     
  3. The average Admin uses a rule-based strategy. This is what permits high volume while retaining precision and dependability. Rules easily translate into firm judgments. They apply this posture to people as well as processes. This can lead the Admin to draw conclusions that are hard to change.  Everyone would do well to make every effort to “get off on the right foot” with the Admin. For their part, the Admin should make every effort to reserve verdicts until they are sure that they’ve got it right.

  4. Admins tend to hate conflict. Conflict introduces emotion that compromises their logical approach. But like any other human, they feel anger, experience resentment and can seethe with rage.  However, they will go to almost any length to avoid confronting this kind of issue directly.  Until it reaches a breaking point.  Then all “heck” breaks loose. The adage that “what you see is what you get” DOES NOT apply to the average Admin. Pay attention to behavioral nuances. They are probably more important than they first appear.
     
  5. An Admins' methodical approach works best in unbroken streams. Interruptions are VERY COSTLY to them. Placing them in situations that demand disjointed actions can be dysfunctional for both the individual and the mission. Avoiding disruptions and recognizing the cost when they cannot be avoided will go a long way towards keeping things running smoothly.
     
  6. Admins know the future is created by new ideas. But their logical and measured step-by-step approach focuses them on facts and cold logic. Expansive visions that inspire and excite other styles are distractions.  Keeping things factual, logical and unemotional is the way to enlist them in your cause.
     
  7. Admins tend to be “glass half-empty” people. They focus on things that can go wrong. This argues against deploying them in the early stages of idea generation where only broad parameters are available. They are likely to close far more doors than they open. This same quality makes them ideal vehicles for refining the quality of ideas as they move from speculation to implementation. The essence of organization is using the right people, in the right situation at the right time.  This mandate applies to Administrative Assistants as well as to everyone else in the organization.
This is not a list of “faults.”  It is a list of corollaries of behaviors and postures. For the Administrative Assistant, it is what allows them to be effective in their role. The trick in managing anyone is to recognize both their strengths and vulnerabilities. Then work to maximize the strengths and minimize vulnerabilities. Trying to “change” anyone is expensive and probably destined to fail (see #4 in the footnotes). The Administrative Assistant position is not an exception.


SUMMARY
The average Administrative Assistant is ideally equipped to provide a stable and reliable foundation for an organization. Within this scope their posture should be praised and supported. Everyone in the organization relies on and benefits from their contribution. They deserve respect and support in performing their function.

On the other side, Administrative Assistants should recognize that other people must use other strategies to do their part for the organization. They also deserve respect and should be given as much latitude as possible to get the job done in their way.

Finally, a caution is in order.  This analysis focused on the average Administrative Assistant. No individual is average.  When applying this knowledge in actual situations there is no substitute for knowing the actual “I Opt” style scores of the people involved.


BIBLIOGRAPHY/FOOTNOTES

(1) Occupational Outlook Handbook, 2010-11 Edition, Bureau of Labor Statistics, United States Department of Labor, http://www.bls.gov/oco/ocos151.htm, referenced February 14, 2012

(2) The raw data upon which the analysis in this section is shown on the table below. It shows the percent commitment to each style by organizational role.


Table 3
PERCENT COMMITMENT OF  STRATEGIC STYLE BY ORGANIZATIONAL ROLE
(3) Nelson, Shannon, 2003. “Secrets of a Logical Processor (LP)".  Journal of Organizational Engineering. Vol 4, No. 4.  December, 2003. The full version can be found on-line at http://www.oeinstitute.org/articles/logical-processor.html.

(4) Salton, Gary, 2011. Predicting Strategic Style Change.  Organizational Engineering Evidence-Based Research Blog. March, 2011. http://garysalton.blogspot.com/2011/03/predicting-strategic-style-change.html. A YouTube video version which both expands and abbreviates the research can be found at http://www.youtube.com/watch?v=-w3nmh2Ts9M.


APPENDIX 1: THE OUTLIER CASE

According to the logic outlined in the text, similarity in style preference should result in a relatively harmonious atmosphere. Counter-intuitively, this is often not what happens among Administrative Assistants with a high LP commitment.

The LP style is characterized by attention to detail. Small divergences can matter.  When you are looking at the world though a microscope everything looks big.  In addition, LPs tend to be very knowledgeable within their area.  The combination of vivid differences and strong logical armament can easily lead to stalemate situations.

A possible resolution strategy is a stepped process. Each LP in the group is likely to have a different view of “perfect.”  The first step is to get explicit agreement that everyone is prepared to settle for a “good” but perhaps not perfect solution. This step relaxes standards and facilitates arriving at an agreement.

The next step is to find common ground.  This involves identifying points of agreement. Pile up as many as possible. Objections can be acknowledged but are set aside for the time being. The natural tendency of the LP is to see a glass as “half empty.” The idea here is to make attempt to refocus on the “half full” aspect of that same glass.

Once positive aspects have been identified attention can turn to a “connect the dots.” Focusing on a few of these “dots” (e.g., steps in project plan) at a time allows the LPs logical capacities to be fully engaged without being overwhelmed by the full complexity of the issue.  The more dots that are connected, the more “real” is the developing solution.

Finally, when working with a strong LP group you should provision a lot of time. It takes time to work though things in detail. The payoff is that whatever is done is likely to “work right out of the box.”


APPENDIX 2: STATISTICAL TESTS
The job titles under which the Administrative Assistant function falls can vary. “I Opt” database includes titles such as Executive Assistant (including “Assistant to”), Administrative Assistant (various levels) and Secretary. Any significant difference in the strategic styles used within these three categories could indicate a fundamental difference in job content. Table 4 (below) tests this proposition.
Table 4
JOB TITLE STATISTICAL SIGNIFICANCE TEST
(a percentage of 5% or less is required to qualify for academic significance)

None of the strategic style differences approach the academic standard of 5% or less. This means that the people in the 194-person sample are using basically the same methods in getting their jobs done.  This indicates that they can be treated as a single, reasonably uniform group.

Table 5 
(below) shows the diversity of the sample across non-profits, educational institutions and for-profit firms. It is sufficiently diverse to be representative of the function in all arenas where it is applied.

 Table 5
EMPLOYMENT SECTOR DISTRIBUTION OF THE SAMPLE

Table 6 (below) compares the “I Opt” profiles of the sampled people working in these various employment sectors. If the content of the job varied by sector it would be visible in the “I Opt” strategic profiles. None of the percentages reach the 5% or less level of academic significance. This confirms that substantially the same function is being conducted in much the same manner in all of these social sectors.  

Table 6
STATISTICAL SIGNIFICANCE TEST: EMPLOYMENT SECTOR
(a percentage of 5% or less is required to qualify for academic significance)
t-Test: Two-Sample Assuming Unequal Variances


Tuesday, December 20, 2011

K-12 School System Management

By: Gary J. Salton, Ph.D.
Chief: Research & Development
Professional Communications, Inc.


INTRODUCTION
This research reports on an evidenced-based analysis of the K-12 school system in the United States. A companion video both abbreviates and expands on the research. It can be viewed on www.iopt.com or by clicking the icon on the right.

Public schools in the United States use a four-tier management system. An elected school
board sits at the top. It is charged with providing the educational resources—both people and funding—and sits in judgement of performance. A direct analysis of this tier is out of the reach of this study. However, some tendencies can be inferred from the character of the system that these boards have created.

The school system is a hierarchy. It operationally consists of superintendents, principals and teachers. This research focuses on the implications of the information processing strategies employed at these various levels (except for the school board). “I Opt” technology captures this in the form of strategic styles. These styles mediate the content of whatever particulars flow through them. “I Opt” is ideologically agnostic and indifferent.


THE SUPERINTENDENTS
The superintendent of schools has locally defined responsibilities. They are typically described as the Chief Executive Officer of a school system. In that capacity they are expected guide educational policy, procedure and practice for a school district. They typically (but not always) are hired by and report directly to an elected school board.

The sample used in this study is of 37 School District Superintendents from 11 states as shown in Table 1. The sample is not large but meets the criteria for the use of standard (i.e., parametric) statistics. It is also sufficiently diverse to represent the range of circumstances that the people occupying this position face.

Table 1
SAMPLED STATES: SUPERINTENDENT


Graphic 1 shows that the superintendents in the sample favor the idea-oriented Relational Innovator (RI) strategy as a principal method of navigating life. Secondarily, the group favors the disciplined, methodical Logical Processor (LP) strategy. This is not a common finding among people sharing the same role.

Graphic 1
STRATEGIC PROFILE DISTRIBUTION: SUPERINTENDENTS


The unusual character arises from the double peak on the RI and LP style dimensions. These are diametrically different strategies. The targeted outcome of the LP strategy is reliability and quality. This is typically gained by the use of proven methods. The RI strategy usually targets major gains realized using new and creative methods, options and discoveries. By definition new methods are unproven. These two dominant styles are not opposites but are mutually exclusive.

There are other unusual aspects to Superintendents. Table 2 displays the unique nature of the role. It shows the R2 (“R Square”) or "goodness of fit" of Superintendent profiles versus various levels in other organizations. R2 is the proportion of fluctuation (i.e., variance) of one variable that is predictable from the other. Roughly put, R2 is a measure of how well one distribution matches another.

Table 2
SUPERINTENDENTS vs. OTHER ORGANIZATIONAL LEVELS
(As measured by the Coefficient of Determination )


The Superintendent’s approach to decision issues is distinct. A visual examination of Table 2 (above) suggests that the core of the difference lies in the action-oriented strategies. Graphic 2 (below) shows that Superintendents (red column) have among the lowest decisive action RS score of any management level. Even college professors, a group not known for quick action, have more of an RS inclination.


Graphic 2
REACTIVE STIMULATOR (RS) COMMITMENT BY
ORGANIZATIONAL RANK


The methodically deliberate LP inclinations of Superintendents show exactly the reverse condition. Table 3 shows that Superintendents are 43% more inclined than CEOs to rely on proven, traditional methods (i.e., <26.9%-18.8%>/18.8%=43.1% more). That is a lot.

Graphic 3
LOGICAL PROCESSOR (LP) COMMITMENT BY
ORGANIZATIONAL RANK


The picture painted by Graphics 2 and 3 are pretty clear. As a group, Superintendents are powerfully disinclined toward responsive action. They will see very little need to act quickly on most decision matters. A sense of urgency is unlikely to be visible in behavior.

Styles of RS and LP are real and visible aspects of behavior that we can all see in each other. But they are not everything. Everyone can be responsive (RS), plan (HA), get ideas (RI) and act methodically (LP). What matters is just how these are balanced one against the other. "I OPT" technology has a way of addressing this issue.

The overall behavioral tendency of a person can be measured by calculating a Cartesian average. This well-recognized tool distills a person's entire behavioral profile into a single point. This is illustrated by the example in Graphic 4. The centroid (yellow dot) characterizes the general tendency of a person across all of the decisions that they are likely to make.

Graphic 4
“I OPT” CENTROID EXAMPLE


Using centroids individual superintendents can be compared with actual individual CEOs (profit, non-profit, proprietorships). Graphic 5 compares these two groups. It identifies the kind of issue resolution method likely to be considered. Every dot is a specific individual. The results are striking.

Graphic 5
CEO vs. SUPERINTENDENT CENTROID DISTRIBUTION
RESOLUTION METHOD ELECTION


Superintendents are far less inclined to both generate and accept new approaches to issue resolution than are Corporate CEOs (74%). However a majority of Superintendents (58%) are still somewhat inclined toward the RI strategy. Graphic 6 fills in the picture. It shows what is likely to be done with whatever approach is selected to be applied.

Graphic 6
CEO vs. SUPERINTENDENT CENTROID DISTRIBUTION
RESOLUTION METHOD ELECTION


Once again the difference is striking. Corporate CEOs (as a group-there are individual exceptions) are much more inclined to use the responsive RS strategy (55%). This behaviorally evidences itself in an experimental approach. CEOs tend to give a new approach a try. If it fails they cut it off quickly. If it works they let it run. They get the benefits from success sooner and thus enjoy them longer. They control cost by a willingness to cut their losses fast.

Superintendents (as a group) take a different course. They strongly favor an analytical approach (68%). They invest heavily in trying to insure that whatever they try will work. This is a risk adverse strategy. There will always be a “good reason” that a particular choice was made. But it also carries the risk “throwing good money after bad.” The heavy analytical investment makes it hard to walk away from failing strategies.

This actual data suggests that Superintendents (as a group) are not likely to be successful if they were transposed into a corporate environment. However, the reason that most (not all) Superintendents share a cautious posture is that a hiring authority (i.e., a school board) believes it to be appropriate to the mission. “I Opt” data on school board composition is unavailable and any judgements are entirely speculative. However, it is worth noting that the “I Opt” profile of the general population from which school board members is drawn would favor a cautious, analytical approach. It is probable that school board members would see themselves as doing things the “right” way and would probably demand the same of the superintendents that they hire.

The size of the Superintendent sample is not large. Questions as to its representativeness are legitimate. But its size is not inconsequential. In addition, the data is striking in its strength and consistency. Further, the analysis appears to reflect actual “real world” experience. It is reasonable to accept the sample as strongly indicative if not exactly representative.


THE PRINCIPALS
The sample used in this study includes 208 Principals from 12 states in the United States as shown in Table 3. The sample includes K-12 public, private and chartered schools and incorporates a very small representation of schools dedicated to special education.

Table 3
SAMPLED STATES: PRINCIPALS

Principals are responsible for the effective functioning of (usually) an individual school. They operate within the framework (i.e., policies, procedures, practices, etc.) established by the Superintendent. This parallels typical corporate supervisory relationships. Table 4 shows how well the Principal’s profile matches those of various levels in other areas of society.

Table 4
PRINCIPALS vs. OTHER ORGANIZATIONAL LEVELS
(As measured by the Coefficient of Determination (R2) )

The R2 column in Table 4 measures the “goodness of fit” and has the same meaning as explained in Table 2. While Superintendents are markedly distinct from their non-school counterparts, Principals appear to fit right in. This relation is visually shown in Graphic 7 (below).


Graphic 7
MANAGER/DIRECTOR vs. PRINCIPAL STRATEGIC PROFILES
(Manager/Director n = 5,313, Principal n = 208)


While similar, Principals are significantly less inclined to use the fast-acting RS strategy (p = 0.00085) than are their corporate counterparts. The tendency to use the cautiously methodical LP strategy approaches but does not quite meet academic significance (p = .068). In total, Principals tend to share the Superintendents cautious posture. This is visually shown in Graphic 8 (below).

Graphic 8
SUPERINTENDENT vs. PRINCIPAL STRATEGIC PROFILES
(Superintendent n = 37, Principal n = 208)

The comparison shows a matter of degree and not kind. Superintendents are more distant from their corporate counterparts than are Principals. If school executives were transported to corporate America, Principals would “fit in” better than would Superintendents. But neither would fit perfectly.

Different organizational levels consistently favor particular “I Opt” profiles (Various Studies, #1 in bibliography). The reason is simple. Different levels have different roles. Time horizons, decision complexity, level of detail, degree of specification and the availability of resolution formats systematically vary by level. For example, corporate CEOs are typically unconcerned with a particular plant’s daily production. A supervisor usually does not spend much time considering the consequences of a long-term strategic sourcing decision. The gaps in these “I Opt” profiles between adjacent levels can give insight into the operation of a hierarchical system. This is done in Graphic 9 (below).

Graphic 9
SUPERVISOR – SUBORDINATE "I OPT" PROFILE GAP
ADJACENT LEVELS FOR CORPORATIONS AND SCHOOL SYSTEMS


The profile gap in Graphic 9 measures the direction and degree of difference between supervisor and subordinate in each “I Opt” information processing style. The zero (red) line indicates no difference. Above that line indicates the leader is stronger in that dimension. Below the line the subordinate is stronger.

The direction of both school and corporate executive relationships is the same. Both lines tend up and down in unison. They are directionally consistent. This suggests that the school-corporate distinction is a difference in degree rather than kind. This in turn tends to confirm that the systematic and predictable nature of the separation between hierarchical levels found in other studies.

The green corporate line in Graphic 9 shows that non-school executives interact to make distinct contributions in every “I Opt” dimension. The average absolute difference between corporate executive levels is 7.8% (see Table 5 below). This is enough to inform both the decisions and their execution. It is not enough to impede communication. In other words, the non-school superiors and subordinates combine to both broaden and deepen the view beyond that which either level would achieve operating alone.


Table 5
ABSOLUTE PERCENTAGE DIFFERENCE
BETWEEN SUPERVISOR AND SUBORDINATE


The blue school executive line in Graphic 9 tells a different story. Superintendents and Principals hold virtually identical positions on the action-based strategies (RS and LP). Neither broadens the perspective of the other on this dimension. Both levels are likely to quickly agree on the direction any actions—whether decisions or their execution—without challenge.

It is a different picture for the thought-based strategies (HA and RI) of school executives. Table 5 shows a dramatic difference. The average gap between school executive levels is more than twice as much as their corporate counterparts (19.7/8.2=2.4 times). Graphic 10 (a duplicate of Graphic 8) shows that this gap is statistically significant for both the analytical HA and idea-oriented RI. In deciding on a resolution strategy Superintendents and Principals are likely to see entirely different worlds.

Graphic 10
SUPERINTENDENT vs. PRINCIPAL STRATEGIC PROFILES
(Superintendent n = 37, Principal n = 208)

The high idea-oriented RI posture of Superintendents generates a wealth of new ideas. But the focus is on expressions of creativity rather than as proposals for immediate implementation. The high analytical HA posture of Principals welcomes new ideas. But as “fodder” for analysis rather than as opportunities for near-term improvement. Both parties celebrate new ideas. Neither is prepared to act on them. The net result is a cauldron of intellectual vitality that appears to outsiders to be aggressively laying groundwork for improvement. But few things actually get done.

Contrast schools with corporations. In corporations fewer ideas are analyzed in lesser depth. Ideas move more quickly to proposals that are then tested experimentally. Ideas that fail are discarded more quickly thus limiting risk. The cauldron of intellectual vitality bubbles less vigorously in corporations but more actually gets done.

The overall picture offered by this assessment is a distortion of the executive interplay. No school system level is focused on using experimental risk as a tool of advancement. The actions school systems will see as “experiments” are probably so well-planned as to be rehearsed procedures. They carry a heavy analytical investment made by many people with vested interests. In these circumstances “failure” is not an information-gathering tool. Failure is a “bad” thing that should be admitted only after evidence has piled up to a point where only the comatose have not recognized it.

It is worth noting that corporations are not a particularly high comparative standard. The ineptitude evidenced in the ongoing recession occurring at the time of this writing is sufficient evidence of its shortcomings. However, in the long run it has shown the ability to adjust and recover. The school system as a whole has shown no such evidence.

It is also fair to note that there are individual Superintendents and Principals who if paired could (and in some cases have) create a dynamic system. Such a system would be capable of producing rapid and substantial advances. However, on an overall system-wide basis the probability of a dynamic system actually occurring on a broad scale is relatively low. There are simply not enough people who hold appropriate profiles to effect this kind of wide-scale
structural change. And that’s not the whole story. There is still another level.


THE TEACHERS
The sample used in this study includes 218 teachers from 11 states in the United States as shown in Table 6. High, middle and elementary schools are included with a small representation of preschool teachers. The schools include public, private, charter and religious institutions.


Table 6
SAMPLED STATES:TEACHERS

Teachers are the delivery vehicle of the school system. Their position parallels the various positions in the corporate world where things are actually done. Table 7 shows how teacher’s profile matches that of other operating levels in the economy.

Table 7
TEACHERS vs. OTHER ORGANIZATIONAL LEVELS
(As measured by the Coefficient of Determination (R2) )

It is important not to view the various levels in status terms. All of the categories are necessary for a society to operate. They are linked or distinguished in Table 9 (above) by the nature of the information flows necessary to fulfill their mission under the system within which they operate. For example, nurses, teachers and hourly manufacturing all deal with “products” whose quality can be directly and immediately judged. Trainers, Superintendents and Scientists (those on the bottom of the list) produce nothing whose quality or value is immediately visible. This kind of immediacy would favor strategies that put a premium on detailed, methodical and certain strategies. There are other factors but this illustrates the relevance of information flows to job demands.

Positioning teachers in the School System management matrix is perhaps best accomplished by first viewing the typical relationships of all levels in a corporate environment. Graphic 11 (below) shows the “I Opt” information processing styles for all levels of corporate management from CEO to non-management. The stair step pattern is typical. The same relationship has been found in multiple studies of different functions and activities (#1, Various Studies in bibliography). It is there because it is functional within a hierarchical system.

Graphic 11
CORPORATE “I OPT” INFORMATION PROCESSING
CONFIGURATION (STYLE)


Graphic 12 (below) shows the hierarchical relationships in the school system. The stair step has disappeared from three of the four styles. The only one that remains is the Relational Innovator strategy. And that one is more severe than its corporate counterpart.

Graphic 12
SCHOOL SYSTEM “I OPT” INFORMATION PROCESSING
CONFIGURATION (STYLE)

However, for the purposes of assessing the teacher position it is sufficient to note that the LP style stands out as an anomaly. This can be more clearly seen by positioning the corporate and school system hierarchies on the same graphic. This is done in Graphic 13.

Graphic 13
“I OPT” INFORMATION PROCESSING STYLE COMPARISON


The sections have been numbered to facilitate reference. The LP style in Section 2 (above) stands out. School management is far more committed to the process-oriented LP style at every level. The teachers are the most committed. As a group they put high value on consistency, predictability and reliability. This is typically achieved by relying on proven methods that have worked in the past. Teachers can be expected to only reluctantly change their teaching practices. The LP is also most comfortable in highly stable situations governed by predictable routines. Change is effectively defined as anything that disrupts established patterns anywhere. This makes any kind of change VERY difficult.

The average school executive shares the Teachers high levels of LP relative to their corporate counterparts. The Superintendent and Principal’s commitment to the LP strategy is only exceeded by the non-management corporate ranks. This builds in a very strong system wide bias against change. The measurements in Section 1 (above) confirm the reluctance toward anything but absolutely certain action. Everyone in the school management structure—from Superintendent to Teacher—has a lower tolerance for change than does their corporate counterpart.

While there is a reluctance to “do” new things, there is no reluctance to talking about them. Principals and Teachers are heavily inclined to study, evaluate, assess and analyze things (see Section 3 in Graphic 13). They are likely to want “justification” on even minor matters. And that justification will probably be required to meet stringent standards. Quibbles are likely to abound and will be taken very seriously at these levels. This drives the cost of a decision up to higher levels than experienced by corporations.

Superintendents are unlikely to concur with either the depth or scope of the analysis sponsored by lower levels. However, they will probably be confronted with group pressures born of the conformity of Principal and Teacher viewpoints. In addition, the pressures of teacher unions are likely to reinforce careful, thorough analysis and assessment.

Finally, Section 4 (i.e., idea-oriented RI) shows that teachers are among the least inclined to offer new ideas that break from current practice. Teachers are likely to take issue with this. They will probably see themselves as idea generators. This perspective will be reinforced by their strong HA inclination. They are likely to welcome the ideas offered by Superintendents and Principals. But this reception will be focused on analysis (HA, Section 3) rather than implementation. In final analysis Teacher ideas will likely be confined to offer only incremental improvements to existing practices. Ideas involving quantum leaps or complete "tear ups" are probably out of range for most teachers.

Teachers are the rock solid base of the school system. Things are done consistently, reliably and with attention to a level of excellence. Interest, compassion and concern typify their stance on non-academic elements of teaching. There is much merit to the LP posture. The challenge is how to integrate it with the demands of changing times.


SUMMARY
The school system’s organization structure is poorly suited to eras where knowledge advances quickly, where resources fluctuate and students with varying needs must be serviced. The likely response to changing conditions will be to apply the existing tools more intensively. Everyone works harder. The effort expended will be taken as evidence that something other than them (i.e., superintendents, principals, teachers) is the cause of negative outcomes. The likely result is a circular firing squad. Everyone ends up blaming everyone else. That is exactly what appears to be happening as this research report is being written.

This report has demonstrated that the organizational impediment to change is structural. Whatever new teaching technique, method or process that is attempted will have to pass through this structure on its way to implementation. In other words, things that appear to work in isolated test or experimental situations are likely to be problematic when applied to the general school population.

Earlier research has shown that the probability of major changes in the information processing structure of anyone is small (#4, Style Stress test; #5, Pattern Stress Test in the bibliography). There are 7.2 million teachers in about 99,000 public schools each with a Principal (
#2, US Census Bureau, 2011) embedded in over 14,000 different school districts with their attendant Superintendents (#3, US Census Bureau, 2011).

Investments attempting to change the information processing structure of existing participants on this scale is possible but difficult. Transitioning the balance of styles over time is a viable long-term strategy. Execution of this strategy does not require everyone to change. The need is for a shift in the structural profile of the group as a whole. This can be accomplished with scattered individual changes. Natural group dynamics will do the rest.

Given the conditions outlined in this article, initiatives undertaken before the structural change occurs should consider the their effect within the current structure. People using highly structured strategies will require a substantial time investment. Highly detailed specification and strong evidence that the proposed initiative will be successful will be needed. The time and detail will probably extend beyond that which people using a more
spontaneous strategy will deem reasonable. But without this investment the probability of success of any initiative is seriously compromised.

There are other strategies that can ameliorate but not resolve the situation. Specifying them is beyond the scope of this research. However, it is worth noting that the current environmental condition will not exist forever. Building organizational structures that can adjust to changing conditions would do much to limit the probability of repeatedly encountering structural issues of this and other types. Altering the structure in favor of the "stair step" configuration typical in other organizations will accomplish this objective.


BIBLIOGRAPHY

(1) Salton, Gary (Various):
  • Salton, Gary (November 2010) Sales Management and Performance. http://garysalton.blogspot.com/2010/11/sales-management-and-performance.html

  • Salton, Gary (October 2010) City Management. http://garysalton.blogspot.com/2010/10/city-versus-corporate-executive.html
  • Salton, Gary (September 2009). The Nursing Staircase and Managerial Gap http://garysalton.blogspot.com/2009/09/nursing-staircase-and-managerial-gap.html

  • Salton, Gary (September 2008). Hierarchy Influence on Team Leadership. http://garysalton.blogspot.com/2008/09/hierarchy-influence-on-team-leadership.html
  • Salton, Gary (August 2008). Engineering Leadership. http://garysalton.blogspot.com/2008/08/engineering-leadership.html
  • Salton, Gary (June 2008). The Pastor as a Leader. http://garysalton.blogspot.com/2008/06/pastor-as-leader.html
  • Salton, Gary (May 2008). Fitting the Leader to the Matrix. http://garysalton.blogspot.com/2008_05_01_archive.html
  • Salton, Gary (October 2007). Leadership, Diversity and the Goldilocks Zone. http://garysalton.blogspot.com/2008_01_01_archive.html
  • Salton, Gary (October 2007). How Styles Affect Promotion Potential. http://garysalton.blogspot.com/2007_10_01_archive.html
  • Salton, Gary (November 2006). Gender in the Executive Suite. http://garysalton.blogspot.com/2006_11_01_archive.html
  • Salton, Gary (October 2006). CEO Insights. http://garysalton.blogspot.com/2006_10_01_archive.html
(2) US Census Bureau, 2011. Newsroom Facts and Figures. http://www.census.gov/newsroom/releases/archives/facts_for_features_special_editions/cb11-ff15.html

(3) US Census Bureau, 2011. School Districts. http://www.census.gov/did/www/schooldistricts/

(4) “IOPT” Style Reliability Stress Test, Research Blog http://garysalton.blogspot.com/2011/03/i-opt-style-reliability-stress-test.html Video summary, 10 Minutes. http://www.youtube.com/watch?v=Vs6eoIsqVkc.

(5) “IOPT” Pattern Reliability Stress Test, Research Blog http://garysalton.blogspot.com/2011/03/i-opt-pattern-reliability-stress-test.html. Video summary, 15 Minutes. http://www.youtube.com/watch?v=0SLg28BhNHU