Sunday, October 01, 2006

CEO Insights - October 2006

The "I Opt" profile of the average CEOs should be of no interest to an existing CEO. Their way is the "right" one. It got them to the pinnacle of the firm and will likely serve them well in that capacity. The CEO's approach should matter to those who need to engage the CEO, who advise him/her or who aspire to be a CEO. For these people this knowledge can be vital.

Professional Communications, Inc. (PCI) has a large database that includes CEO "I Opt" scores. CEOs have been contrasted to other levels in the firm in earlier research blogs. This blog looks at how different CEO’s are from each other.

THE AVERAGE CEO

Graphic 1 shows the average of the 98 CEOs in the "I Opt" database. The average CEO's interest appears to center on producing creative options and on acting to secure them.


Graphic 1
The average CEO’s RI (Relational Innovator) style is dominant. It is geared to plotting a course for the firm. The CEO seizes on new insights and explores what they might mean to the firm. How a new insight might fit into the business system is quickly outlined. A collegial atmosphere tends to surround the CEO when operating in this mode. The CEO is open to changes, modification and elaboration. A vision of what might be is being created.

Not every issue yields to the RI strategy. Even when it does, the creative process will sooner or later be exhausted. The CEO then shifts to their next most favored strategy, the Reactive Stimulator (RS). At this point talk is over. It is now the time to "do." The CEO's focus changes from what to do to when it will be done. Collegial give and take is replaced by authoritative direction. Milestones are set and commitments sought. Focused action is the CEO’s interest.

The world is not linear. Neither is the CEO's approach. They bounce back and forth between their preferred strategies. The combination catalyzes the adjustments the firm needs to navigate an ever-changing environment. The average CEO is a creative “doer.”

The “take home” from the above is that if you want to engage an average CEO, bring something creative to the table. Attach some kind of action proposal (RS) to it and be ready to move if it is accepted. Having some analytical HA material available explaining why a course has been selected is probably advisable but it should not be stressed. The least important thing is laying out exactly how things are to be done.


NON-PROFIT CEOs
Sixteen of the 98 CEOs in the "I Opt" database head non-profit or government (state and federal) agencies. Non-profits face more nebulous missions than firms in the profit-sector. There is no clear “bottom line.” Market feedback is slower and less clear-cut. These differences reflect themselves in the CEO’s profile as shown in Graphic 2.

Graphic 2
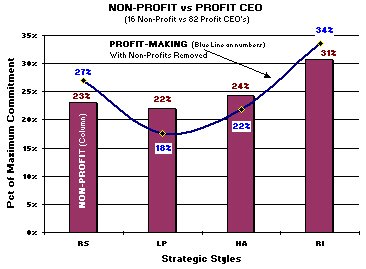
Non-profit CEOs favor the RI (creativity) strategic style but with a bit less intensity. Less defined goals make figuring out how a new idea “fits in” more difficult. A slower market feedback means less reliance can be placed on decisive action (RS). Too much damage can accumulate before a problem is known. In response the secondary strategy shifts to the analytical HA. Initiatives are more likely to be analyzed before being acted upon. Getting it done right is more important than being first to market.

All of the secondary strategies lie close together in strength. This is testimony to the nature of mission. The advantage of one strongly dominant secondary style is less clear cut. Like other CEOs the non-profit CEO is plotting a course in an uncertain environment. They are doing it more cautiously because they have to.

The “take home” from this mini-analysis is that the non-profit CEO can be engaged with creativity. However, the process of deciding what (if anything) to do will be longer. There simply are more things to consider. The balanced secondary styles mean that they may appear more “reasonable” than their profit-sector equivalents. They will seriously consider a wider range of proposals. The cost is elongated discussion and slower decisions.

Keep in mind this is mini-analysis is based on averages. There are non-profits with explicit goals and fast feedback. This means that there are non-profit CEOs who use strategic patterns similar to the profit-making sector. But these people will not be the typical non-profit CEO.


LARGE FIRM CEOs
Larger firms tend to face complex issues and their decisions usually involve more stakeholders. The 82 profit-sector CEO’s in the database can be divided by size. Twenty-three have revenue of over $100 million. This should result in a different strategic profile—and on average it does.

Graphic 3
Graph 3 shows the style distribution with the non-profits excluded. Large-firm CEOs appear less willing to take decisive action and more inclined to subject initiatives to analysis before acting. Graphic 4 shows that smaller firms are more likely to have CEOs who are prepared to act more aggressively. Large firm CEO's are also prepared to act but none occupy an extreme position. This reduces the overall RS average of large firm CEO shown above in Graphic 3.

Graphic 4
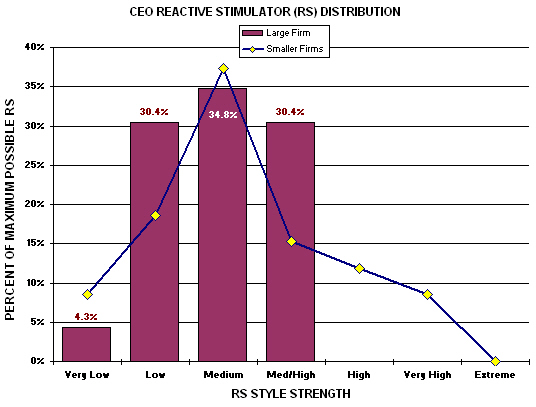
The analytical HA offers a similar story but on the other side. Graphic 5 shows that the large firm CEOs are seldom found at the "very low" HA level. They have been shifted to the "low" level. This move has the effect of increasing the large firm CEO's average HA score. In other words, the higher overall HA is due to fewer people in the very low category rather than to more people in the higher ones.

Graphic 5
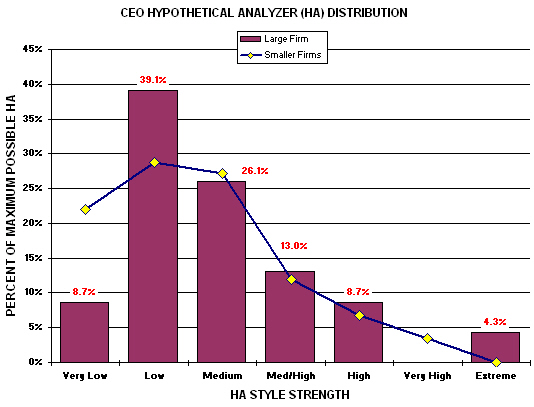
The difference in large and smaller firm CEO profiles lies in the extremes. Large-firm CEOs are inclined to cluster in a band in the middle of the spectrum. It is likely due to the nature of the decisions being made. Complex decisions combined with multiple stakeholders probably favor moderate people in the CEO chair of larger firms.

Strategies that work for the CEOs of smaller firms are likely to be transportable to larger firms. The CEOs are equally interested in creative ideas. Their response to an initiative is likely to be more moderate but of the same character. In terms of decision-making information flows, what works at one CEO level will probably work at another.


BANTUM FIRM CEOs
A 27-person segment of the profit-sector database consists of firms with less than $10 million in revenues. These firms live in a more precarious world. Their leaders might be expected to be sensitive to different information flows than their larger cousins. This is not the case.

Graphic 6
The CEOs of the smallest firms look just like their larger brethren in terms of the structure of their information processing profile. They place highest value on creativity (RI) and are quick to action (RS). But there is a difference and it lies in the detail.

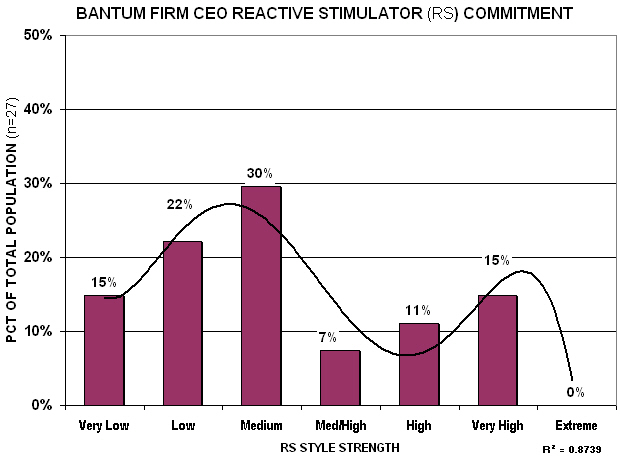
Graph 7 shows that the RS component is not linear. There seem to be two kinds of bantum firm CEOs. One set is relatively conservative in the use of decisive action. The other is aggressive. This may be due to the variety of different businesses (i.e., from janitorial firms to system integrators) in the sample. Or it may be that different strategies are equally viable. The charts do not answer this question.

Graphic 7
The CEOs of the smallest firms also put less stock in creativity (RI) than do both larger firm and non-profit CEO's. They average to about the same overall level. However, highly creative CEOs are more likely to be found in the bigger rather than smaller firms (see Graphic 8 "high" category). Thin resources may focus smaller firms on more certain strategies. Whatever the reason, it is less likely that a bantum firm CEO will be engaged by creative possibilities than will the CEOs of larger firms.

Graphic 8

The "take home" from this mini-analysis is that smallest firm CEOs are more variable than are their larger firm counterparts. Some will move VERY decisively but most will assume a more cautious posture. Creative options will be of some interest but are less likely to engage the bantum firm CEO.


SUMMARY
Graphic 9 shows an overall family resemblance among CEOs of all types. The non-profit CEO is most unique but still echoes of the profit-sector CEO profile.

Graphic 9
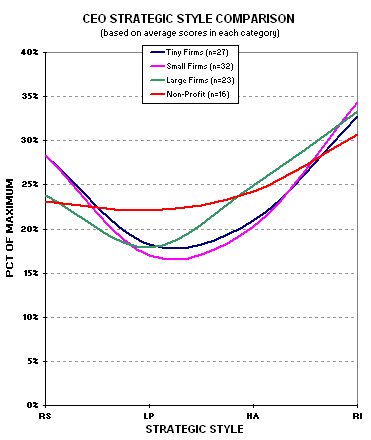
The reason for the similarity probably lays in the common role the CEOs fill in any organization. Their job is navigating the future. Standard practices and existing methods are in the competent hands of others. The CEO role is to identify opportunities for meeting the conditions of a business environment that does not yet exist. The creative RI strategy is best suited for that purpose. It is likely that CEOs either develop or are selected for their strength in this area.

Once a course has been plotted the CEO role is to cause the firm to follow it. This responsibility is best served by the decisive and action oriented RS style. The posture is tempered in the case of large and non-profit CEOs in favor of the analytical HA style. It is likely that the most important factor in this shift is the influence of stakeholders. The absolute magnitude of decisions attracts and motivates the large firm CEO's stakeholders. Satisfying this wider mix of interests likely results in a more tempered posture.

The more nebulous mission of the non-profits has the same effect. Here stakeholders probably attempt to "bend" decisions in favor of their own interests. Without a definitive "bottom line," analysis (HA) is the only tool available for sorting out the interests' relative to the issues.

Smaller firm CEO's in the profit-sector are the least restricted of the group. They have fewer stakeholders. This means that the decisive RS will be evidenced in visible behavior more quickly. The level of creative RI may be less pronounced (in terms of distribution) but will be visible faster. Hence the smaller firms will be seen as being more nimble and more creative than their larger-firm counterparts.


Sunday, June 18, 2006

Consultant Profile: Getting the Gig

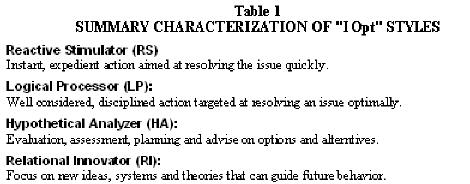
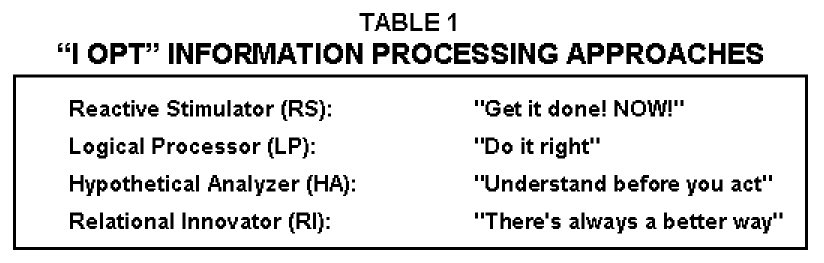
Organizational Engineering (see www.oeinstitute.org for more information) looks at the world through an information-processing lens. The basic idea is that the world can be navigated in a variety of ways (e.g., there is more than one way to get to Chicago). Different objectives favor different strategies (e.g., the fastest road vs. the most scenic). These "I Opt"® strategies can be informally summarized as:

Professional Communications, Inc. (PCI), the creator of "I Opt" (see www.iopt.com for more information), maintains a large database of “I Opt” scores. This article uses this data to explore the characteristics of professional consultants.

BASIC CONSULTANT PROFILE

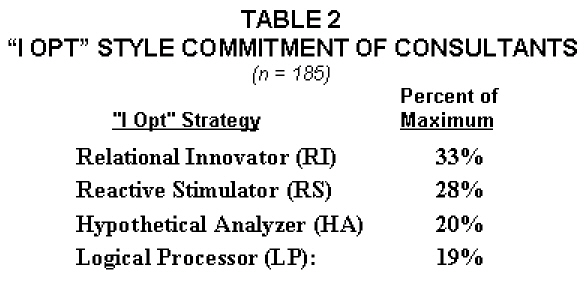
Consultants provide subject matter expertise. Clients contract with them to solve problems. Normally, the relationship is short-term. Once the issue has been addressed, the consultant moves on. The similarity in services offered, the nature of client relation and duration suggest that there will be a commonality in “I Opt” styles among consultants. This commonality is outlined in Table 2.


Not surprisingly, the idea-oriented Relational Innovator (RI) style is favored. Consultants are usually called when there is a vexing problem. The "usual" solutions have already been tried. The consultant is expected to bring in new ideas, options, and approaches. Consultants who consistently display this creative ability will be favored—and they are.

The strong secondary position of the RS might be somewhat unexpected. This "get it done" posture makes sense, however, when you consider how consultants are paid. They typically work on an hourly or daily basis (at the time of this writing, about $2,500 to $3,000 per day for a "typical" consultant). Clients pay for results. Analysis, evaluation, and assessment (an HA posture) do not usually qualify as the “results” being sought.

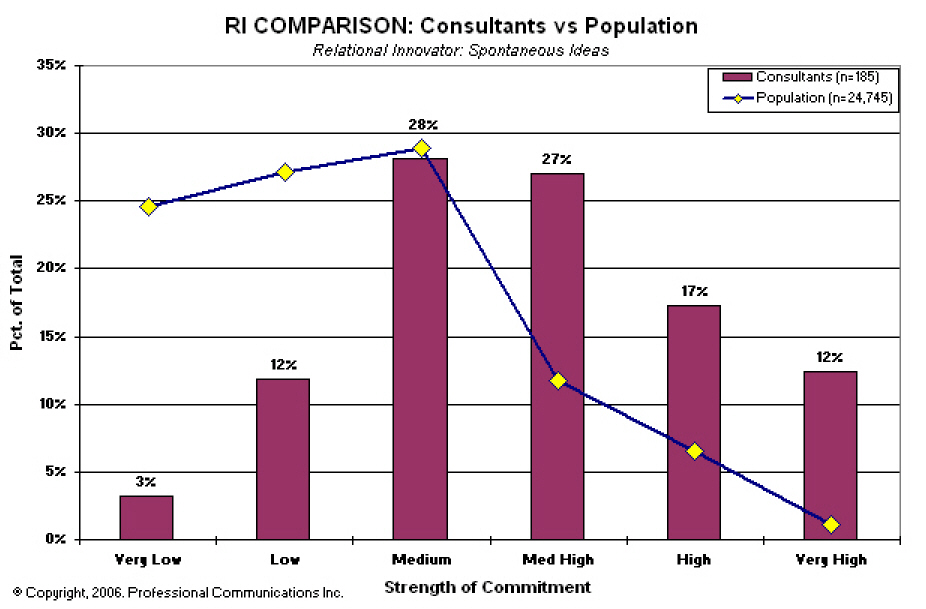
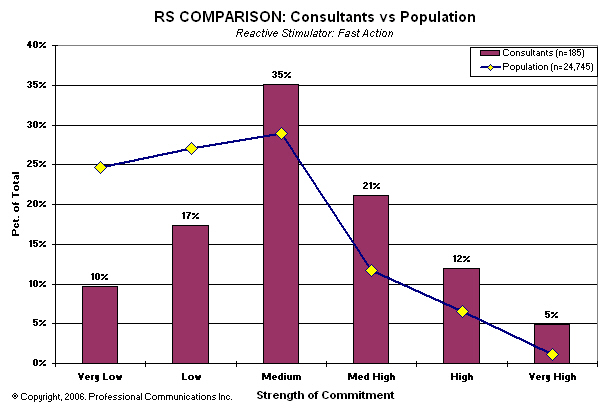
Comparing consultants to the general population highlights the uniqueness of the consultant's approach along both the idea and action dimensions.

FIGURE 1
RELATIONAL INNOVATOR (RI)

FIGURE 2
REACTIVE STIMULATOR (RS)

There are consultants in every strength category for both RS and RI. However, the degree of difference with the general population is striking. The general population dominates the distribution at lower strength levels. The consultants dominate at higher levels.

Consultants are not always warmly received by the staffs of the client with whom they work. The difference in basic approaches to issues may be a basis for this result when it arises. From the perspective of the general employee pool, the consultant will not be approaching the issue in the "right" way. Compound this with the perceived high compensation (they do not see the unpaid hours) and a bit of tension is understandable.


A take home from the above observation is that a consultant should not expect affection from the people with whom they work in solving corporate issues. Some among the staff will see value in the approach. Most will not. Similarly, the client commissioning the work should expect to hear grumbles from the staff. The measure of success is the solution of the issue. One price of this solution may be a bit of disquiet among the lower levels.


INTERNAL vs. EXTERNAL CONSULTANTS
The "I Opt" database has a sample of 67 people who have been identified as internal consultants. Like external consultants, these people tend to be project oriented. They also move in and out of the various parts of the firm. The parallel between the work of internal and external consultants is strong. On its face, we would expect internal and external consults to approach issues in roughly the same manner.

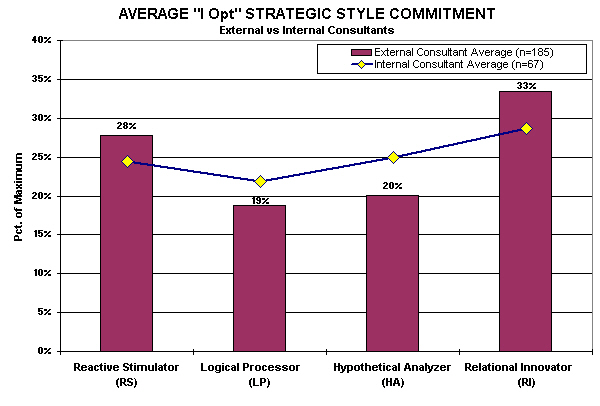
Figure 3 shows the average strategic style strength of internal and external consultants. The similarity in style profiles is obvious, as are the differences.


FIGURE 3
EXTERNAL vs. INTERNAL CONSULTANTS

STRATEGIC STYLE COMMITMENT

Overall, internal consultants have less of a commitment to the spontaneous RS and RI styles. These differences are academically significant (RS p<.05; RI p<.01 using the Mann Whitney U Test). Internal consultants also show a higher commitment to the disciplined HA and LP styles. The HA meets the academic standard of significance (HA p<.05) while the LP fails. Overall, it is fair to say that these differences are probably not due to pure chance.

Internal consultants will tend to be somewhat more disciplined. Their higher scores in HA suggest the greater use of disciplined thought. The higher LP suggests more stress on methodical execution. This posture limits the strength of the unpatterned RS and RI styles. The more discipline, the less spontaneity. The tradeoff cannot be avoided.


A moment's reflection suggests a possible reason. Internal consultants are paid a salary. "Real" consulting gigs are sporadic. External consultants leave. Internal consultants must find a way to stay busy inside the firm. Planning/analysis (HA) or executing established processes and programs (LP) are inviting activity candidates. These are low risk activities that keep you out of trouble as you await the next gig. As an internal asset, it is usually a good idea to save your ammunition for the times when you will need it.


The take home from this mini-analysis is that internal and external consultants are both similar and different. People can readily move between the categories. Client firms often hire their external consultants. Internal consultants often move into an external role. Both are viable strategies for the average consultant.


The mini-analysis also suggests the difficulties both types of consultants will face in a move to the other side. Internal consultants will tend to over invest (the HA and LP effects) in preparation. This will delay the point at which they will get traction. External consultants will tend to be a bit too aggressive. This posture will likely cause some political issues. These will delay their full integration into the firm. Both internal and external consultants will have crosses to bear if they move to the other side
.


CONSULTANTS vs. HIERARCHICAL LEVELS
Consultants must sell themselves to get the gigs on which they depend. A first principle of sales is to “mirror” the prospect. The closer their “I Opt” style matches their prospect, the more likely it is that they will “connect” with them. That connection is the first step on the path to securing a new client.


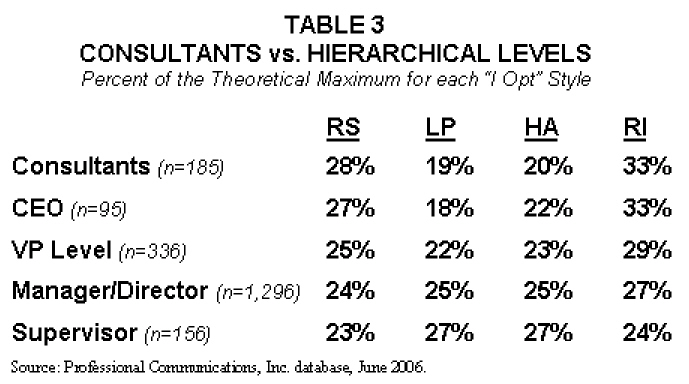
The higher the hierarchical level of a prospect, the more likely it is that they will be able to sign the contract to solidify the gig. Table 3 shows the average “I Opt” style commitment of people at various hierarchical levels who might be able to “ink” a contract.


Table 3 shows that the average consultant most closely matches the profile of the average CEO. A correlation coefficient of .98 confirms the common sense notion that if a consultant can get the CEO, they should. The reception is likely to be warm. They are birds of a feather.

The problems a consultant is brought in to resolve, however, usually exist at lower levels. The normal state of affairs is that the consultant must traverse multiple levels before finding someone who will actually sign a contract. Figure 4 gives a picture of the "I Opt" style differences that exist at the various hierarchical levels.

FIGURE 4
CONSULTANTS vs. HIERARCHICAL LEVELS
Percent of the Theoretical Maximum for each “I Opt” Style

The average values shown in Table 3 are plotted in Figure 4. The match between the average consultant and CEO is obvious. As you move down the hierarchy, the structure of the “I Opt” style pattern systematically changes. As you move down the hierarchical scale, the middle of the bands in Figure 4 flex upwards. This section of the chart represent the commitment to the disciplined HA and LP styles.


At lower levels, facts and logic dominate—prospects want to be shown that your proposal is likely to work. As you move up the scale, facts and logic become less important. The creativity of your ideas and a willingness to act quickly becomes more important. The risk is that the consultant will not recognize that the game is changing as a proposal migrates up the chain.


Entry level work usually involves appeasing lower level executives. Elaborate and detailed presentations are in order at these levels. These productions usually require a lot of work. The consultant will be tempted to amortize his/her investment by carrying it to the next level. The higher the jump, the less effective will be the “let’s reuse what we have” strategy.


The take home from this mini-analysis is the consultants must be willing to invest. Proposals must be retooled if more than one level is involved in getting a gig. The work done at lower levels becomes backup. It might be needed because not everyone at a particular level is average. However, as you migrate up the chain, increasing effort should be invested in principles, concepts and action options. Less should be invested in “why” and “how.”


SUMMARY
The Organizational Engineering database has enabled us to make some useful observations on consultants both internal and external. These include:
  1. Consultants are not like everyone else. An information-processing strategy leaning toward spontaneity in ideas and action is favored.

  2. The higher you go up in the hierarchy, the more likely it is that the consultant will “connect” with the prospect. The often repeated advice to “shoot for the top” is good counsel.

  3. If you have to navigate different levels to get the contract inked, expect to invest in retooling your proposal. Attempting to save work by reusing a presentation at different levels may be a formula for failure.

  4. If you get the gig, prepare the client for a bit of discord. On the whole, the internal staffs may not warmly receive your efforts. You are going to approach the issue differently than they might prefer. The reason you are there is to offer a different approach. A bit of tension is a natural outcome of this condition.

  5. Going over to the other side is a viable strategy. The external consult has an exposure in being a bit too aggressive. The RS and RI strategies that kept you alive when on the outside can be a source of political friction when you are on the inside.

  6. The internal consultant moving to the outside is likely to spend a bit of time getting traction. There might be a tendency to over-invest when preparing. This time would be better spent in marketing. There might also be a bit too much reliance on traditional, proven methods. People hire you because you bring a new perspective. Pulling out too many well-worn tools diminishes one of your principal competitive advantages.
This mini-analysis is also a practical demonstration of the value of the “I Opt” information-processing approach to analyzing behavior. A brief orientation, a few simple statistics and a small number of graphs provided “take home” observations that are worth taking home.

The websites www.iopt.com and www.oeinstitute.org can orient you to the standard tools and their practical applications in the real world. This Blog demonstrates that the data collected in those applications can have a value in and of themselves. The “I Opt” information-processing approach is able to yield continuing, as well as, immediate benefits.

Wednesday, October 26, 2005

Leadership Development

Professional Communications Inc. is the creator of "I Opt" technology (www.iopt.com). The firm has accumulated a large volume of data on real teams functioning in all areas of society. This blog is an effort to convert some of this data into information of value to people involved in leadership development


SHORT-RUN LEADERSHIP BEHAVIOR

Dr. Ashley Fields’ 2001 Doctoral Dissertation investigated the “I Opt” strategic style preferences of leaders.


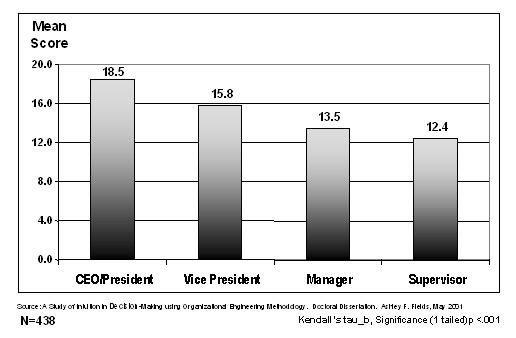
Using Professional Communications’ Summary database, Dr. Fields found that the Relational Innovator (RI) was the strategic style most characteristic of leaders. A portion of his findings are shown in Graphic 1.

Graphic 1
Relational Innovator (RI) Scores by Organizational Rank
(Click here to view entire dissertation in Acrobat)

Dr. Fields' discovery was more important than just finding that the RI style dominated. He found a “stairstep” function—the higher the organizational level, the higher the level of the Relational Innovator (RI) style. This finding suggests:

Leadership development should focus on developing a
RI capacity among its pool of all future leaders at all levels.

Another implication of the “stairstep” is that the optimal level of RI is not the same for every position. The levels of RI appropriate for a CEO is not the level that is optimal for a supervisor and vice versa. This means:

Leadership development will have to align its offerings
with the level of the people it is developing.


Dr. Fields’ findings are an important first step. The next step is to focus on the longer-term behaviors of leaders.


LONG-RUN LEADERSHIP BEHAVIOR

Most issues of significance involve a series of decisions. Even if the first decision yields to the RI approach, it is very unlikely that the next decision in sequence will succumb to the same strategy. This is where a person's secondary style comes into play.

A secondary style is the next most likely to be used where the primary style does not apply. The combination of the most and the next most used style will come to characterize behavior. This concept is captured in the "I Opt" variable called "Strategic Pattern."

Strategic patterns are combinations of behaviors connected by a commonality in either method (input) or mode (output) strategies. Patterns usually (but not always) combine a person's primary and secondary preferences. Table 2 defines the "I Opt" behavioral patterns.


I conducted a study to identify the strategic pattern most favored by leaders. Our Hierarchical Database contains information on 919 teams. Using this database it is possible to identify the strategic pattern (primary and secondary style) that most differentiates the leader from the remainder of the team. The results of this study are shown on Graphic 2.

Graphic 2
Leadership Strategic Pattern Distribution in Teams


Changer is the dominant pattern.
This finding suggests that the current social environment favors a strategic pattern based on innovation, speed, experimental implementation, and so on. The cost of this approach—suboptimal solutions, high failure rate, and organizational disruption -- does not appear high enough to offset the advantages of the strategy. The implication of this finding is:

It is not enough to focus exclusively on the RI (idea) capability.
A secondary RS
(quick action) capacity must also be developed.

The Changer Pattern is not a universal "good."
Not every leadership position favors the Changer pattern. Both the Perfector and Performer positions are also strongly represented. An examination of the database suggests that these patterns are probably functionally determined. For example, sales management seems to favor the Performer pattern (“Get it done!") while university level academicians lean toward Perfector ("Let's think it through"). The implication of this finding is:

Developing effective leadership is situational.
Leadership development must be sensistive to the leader's area.

The least represented pattern, Conservator, has its place.
This pattern seems to be found in areas where accuracy is more valuable than innovation. Applied science leaders as well as Certified Public Accountants show a greater representation of the Conservator pattern. These high accuracy areas can be vital to business success. The implication is:

Leadership development must create a respect for different
leadership strategies. If everyone tries to be a Changer, the
organization will probably suffer.


GLOBAL IMPLICATIONS

The central implication of the findings is that a "one size fits all" approach to leadership development is probably ill-advised. Leaders targeted toward sales management need a different approach than those targeted toward banking. To be fully effective:

Leadership development must be sensitive
to the nature of the leader that it is trying to create.

Another implication is that normative models (models based on a survey of opinions of leaders in a specific area) probably incorporate a mixture of human information processing patterns and industry specific variables. This probably accounts for the 171,612 books on leadership currently available on Amazon (as of October 25, 2005). This suggests:

Information processing preferences can be
treated separately from local variables
.


Both elements are important in leadership. Treating each separately makes teaching easier and learning more effective. Combining the two elements can create a tangle of permutations that can be hard to put into actual practice.

A final implication is that there is much more to leadership than indivdual skills. Leaders must work together if the goals of a firm are to be fully realized. Since leaders are not clones, it can be expected that the information-processing styles being used will clash with as well as complement each other.

Leadership developement should anticipate this condition. People typically believe that their "way is the right way." That is why they use it. They have to be shown that other strategies have value and can be meshed to create a whole greater than the sum of the parts. This suggests that:

Leadership development efforts should include sessions
where the relative advantages and vulnerabilities

of each pattern are made visible.


This blog is not an attempt to lay out an academically definitive theory of leadership. It's intent is only to outline some of the obvious implications flowing from the data on actual teams functioning today in the "real world." If it stimulates the thinking of people involved in leadership development, it has served it’s purpose.


Tuesday, February 22, 2005

"I Opt" Validity: Validation Explained in English

Clients and prospective clients invariably ask about the validity of "I Opt." Since "I Opt" (www.iopt.com) is the only tool in Organizational Development that I know of which has been FULLY validated this question is always welcomed.

My typical response is to send them to www.oeinstitute.org and have them read the full study. Recently, I went back to the study. As I read it, it occurred to me that the study presumes the reader has a knowledge of statistics beyond that which most of my clients possess. This Blog is meant to define the dimensions of validity in a language that anyone can understand.

MOVING FROM SPECULATION TO "FACTS"

In final analysis, validity is an argument about whether your theory can be trusted. Validity dimensions are just points of evidence that you use to support your point of view on a subject. In the case of "I Opt" that subject is a theory of the behavior of groups and individuals.

A theory is just a statement of "what causes what." Theory is what you use to understand life. Theory is the basis on which you diagnose a situation. Theory is the foundation on which you base your recommendations that will change the lives of others. Theories are important.

Like everything else, theories come in gradations. At the bottom is speculation. This is an opinion and everyone has them. Like any other commodity with unlimited supply, they are not worth much. At the top are "facts." These are things whose truth is unquestioned by any reasonable person. Facts are usually in short supply and their price is the work you have to do to establish their truth. Most of the things we think we know exist somewhere between speculation and facts. Validity is a tool we use to move up on the scale toward "fact."


DIMENSIONS OF VALIDITY

CONTENT: This means that the components of the tool you are using (e.g., statements in the "I Opt" Survey) relate the theory in a meaningful way. If you do not have Content Validity you could be trying to measure distance with a thermometer. You will never know. "I Opt" has a Nomological Net. This tracks each "I Opt" response directly back to the underlying theory. The Net gives assurance that the "I Opt" tool is measuring what the theory is talking about.

FACE: The respondent (e.g., person who took the "I Opt" Survey) agrees with the diagnostic. This is often dismissed by the academicians. However, from a practitioner's standpoint, it is the most important measure of validity. If you do not have Face Validity you will be arguing with your client about the "truth" of the diagnostic you are trying to give. It is a great way to lose a client. "I Opt" has 99%+ face validity.

CONSTRUCT: This gives assurance that the measurement is right. If your tool measures literacy, a positive result would indicate that the respondent can read. If your tool says that the person can read and he cannot, you have measured the wrong thing. "I Opt" has a statistical significance in this dimension of p=.0152 . In other words, there is less than a 2% chance that this positive result could be found by chance. Academia is a bit more relaxed and usually takes 5% as their standard.

CONVERGENT: This dimension of validity assures you that things in the real world that should relate to each other do relate. For example, a tool that tries to measure "creativity" should be directly related to another tool that measures the frequency of novel responses. If they do not directly relate, you have probably measured something other than "creativity. " The "I Opt" validity study tested this along four dimensions and each met or exceed the academic p< .05 (less than 5% probability that the results are due to chance) standard.

DISCRIMINANT: This dimension of validity assures you that things in the real world that should not relate to each other do not. For example, the "styles" of people in R&D, Customer Service and IT would be expected to be unrelated. The different demands of these different areas would seem to require different "styles." If it turned out that your tool measured the same style mix in these different areas you probably do not have a style measure that can be used in work allocation. "I Opt" met the discriminant validity test with a significance level of p< .000000000000000000000000000000000001 or that there is less than 1 chance in a gazillion that this result was due to chance.

CONCURRENT:
Concurrent validity says that the results (e.g., "I Opt" diagnosis) relate properly to other things outside of the theory being tested. For example, if someone scored high on an "introvert" scale in MBTI, we would not expect him or her to be found frequently dancing on tables with a lampshade on their head. If your tool scored a group as having high introversion, and someone else measured them high on a scale of "table dancing", you probably failed this test. "I Opt" has an inaccuracy rate of ZERO in its alignment with other measures. In other words, it fits with other things that it should fit with.

PREDICTIVE: This validity test says that the future can be predicted in a testable way. In other words, you should be able to foretell the future before that future happens with a high level of accuracy. "I Opt" was measured for six consecutive predictions and the worst that it did was p<.01 (less than 1% probability that the results are due to chance). On other tests "I Opt" registered an INACCURACY rate of ZERO. In other words, what "I Opt" says will happen does happen.

CONCLUSION: This test asks if the results are reasonable in the “real world” (sample size, statistically stable, etc.). In other words, can the results be trusted. For example, if you tested your tool on 30 students you may be able to meet all of the validity measures above. However, would you trust your results if that tool were applied to all of the million employees of WalMart? I would not. Or, you may apply parametric statistics (i.e., tests that use the normal curve) on data that has not been tested for "normality." You could argue the statistics are "robust." The question is if they are robust enough. No one will know. "I Opt" demonstrated its Conclusion Validity by using a large sample (over 14,000 people), enlisting 50 mature experts (VP's, Ph.D.'s, Directors of OD, Consultants and etc. It did not use inexperienced students) and applied rigorous statistical assessments. What this tells you is that your validity tests really mean something in practice.

RELIABILITY: This measures says that if you did it again, you get the same result. This is not a measure of validity as much as a measure of repeatability and consistency. "I Opt" again met and exceeded the academic standard.


SUMMARY

Validating a theory is expensive and time consuming. The investment only makes sense when you are working with a theory that you expect to be employed widely and applied in important areas of life. For example, if you are working on a program that will only be applied in your firm you can probably forgo validity tests. You can tell pretty quickly if it meets your needs and then figure out if it is worth the investment.

However, validation is a baseline requirement if you are offering a product that will:
(1) be applied to people you do not know
(2) in areas that you are unfamiliar and
(3) over timeframes that extend beyond your lifetime

Here you are asking people to put their faith in your theory and use it to alter the lives of other people based on its "truth." Under these conditions the time and expense of validation would seem to be a minimal requirement that should be provided by the builder and demanded by the buyer.