Shannon Nelson, CEO
Professional Communications, Inc.
INTRODUCTION
This evidence-based research investigates the degree to which senior IT management “fits” into the organizational structure. The technology applied is able to identify reasons for the conditions discovered as well as the opportunities and exposures implied by those reasons. The study investigates optimal IT reporting relationships by building on exploratory research done by Deloitte Consulting (1,271 CIO’s, 43 countries; see footnote #2). It isolates a cause for varying levels of IT reporting relationship satisfaction. The study also measures the compatibility of senior IT levels to their peer VPs in different functions. It finds both opportunities and exposures in these relationships.
 |
| View Video |
THE RESEARCH TOOL
A common denominator of any
difference in strategic orientation will be the information processing methods
used. Different strategic focus will require that attention be paid to
particular inputs. A specific
character of output will be
targeted. And a unique mechanism (i.e., process)
will be needed to connect the logic of the input used with that of the output
issued. This approach is instantly recognizable as an application of the
classical engineering model of input-process-output.
Image 1
THE BASIC MODEL

“I Opt”
technology offers a method of measuring the basic information processing
strategies being used in real world situations. The scope, predictive accuracy,
validity and effective range of “I Opt” has been extensively documented and
reported (see Footnote#1 for multiple citations).
Many more such papers, articles, research studies and tools can be
accessed on our websites at www.iopt.com and www.oeinstitute.org.
As is the
case with any advanced technology, “I Opt” requires a vocabulary to convey
meaning in a reasonably efficient manner. Central to this vocabulary is the
concept of strategic style. This refers to specific combinations of
input-process-output that are repeatedly encountered in life. These
combinations of characteristics have been named and those names are used in
this study. So as to limit the burden on the reader this research will cite
relevant defining characteristics as these terms are used.
THE RESEARCH FOCUS
The focus of
this paper is senior IT leadership. People carrying the title Vice President (including
SVP and EVP) are senior
executives by definition. The position of Chief Information Officers (i.e.,
CIO) is not as
transparent. This title can conceivably
denote a policy making position or an executive position charged with executing
policy laid out by others.
This study
tested the potential misclassification exposure by comparing the information
processing profile of two groups—those with the formal VP tile and those with
only a CIO designation. Table 1 shows no statistically significant difference
between the way CIOs and IT VPs approach issues.
Table 1
COMPARISON
OF IT VICE PRESIDENT AND CHIEF INFORMATION OFFICER

The academic
standard to declare a difference to be “significant” is .0500 or less (i.e., 95% or better chance that the difference is
non-random). The VP-CIO
difference does not even approach the academic standard. This commonality means
that VPs and CIOs can be combined into a single group for our present purpose.
There will be no distortion when comparing IT senior management with other
functions.
THE SAMPLE
The database consists of 2,526 senior
executives distributed as shown in Table 2. These are the various groups with
whom IT senior management interacts in the course of fulfilling their
functional role.
Table2
SAMPLE
CHARACTERISTICS
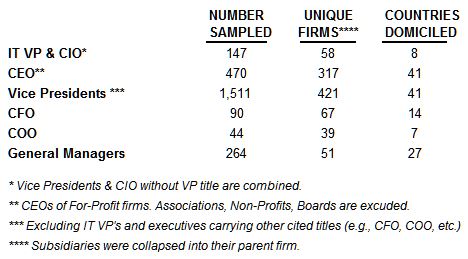
The
Vice President category in Table 2 consists of VP’s who do not carry a “C”
level designation (i.e., COO, CFO, etc.). Table 3 compares IT senior
executives (n=147) with these other comparable VP levels (n=1,511).
There are two strategic styles that closely approach statistical significance,
Logical Processor and Relational Innovator (shown in red in Table 3).
Table 3
COMPARISON OF IT VERSUS
NON-IT VICE PRESIDENTS

The
Relational Innovator (RI) style misses statistical significance by 0.1%. This
could easily be flipped to significance with an increase in sample size. The
magnitude of the difference (i.e., 9%) is large enough to be visible in
ordinary transactions at the VP level. Graphic 1 below looks at that difference
in more depth.
Graphic
1
COMPARISON OF IT AND NON-IT
VPs: RI STYLE

Graphic 1
shows the level of commitment to the RI style which is focused on innovation,
options and alternatives. It is obvious that it is not the entire range of IT
VPs driving IT’s ~10% advantage in this style. Rather it is driven by several
“clumps” of highly committed IT senior executives. These are highlighted by
designator “A.” This
means that the judgment of the creativity of IT executives is likely to be
uneven across companies. This is not unexpected since different firms confront
different digital environments (e.g., a focus on innovation vs.
security). Companies are
likely to select IT executives that match the constraints that the firm
confronts. This is the likely source of the variety of positions represented in
Graphic 1
Graphic
2 shows the distribution of the Logical Processor (LP) style for IT and other
executives. It also approaches statistical significance. But here the variation
between the IT and non-IT group pops up and down across the entire range of
commitment. It is likely that IT’s lower reliance on proven methods (LP -7%) will be sensed rather than
objectively recognized. It is probable that variation in this dimension will
remain a nuance coloring a relationship rather than a focus of explicit
interest.
Graphic
2
COMPARISON OF IT AND NON-IT
VPs: LP STYLE

The foregoing
addresses the overall relationships. Any averaging process nets out bad and
good relationships. Non-IT executives positively affected will tend to balance
out those with negative views. The overall effect is that IT executives will
tend to be seen as more creative in their approach and perhaps a bit wanting in
their attention to detail. Not a bad overall fit.
Individual
IT executives deal with particular functions and not averages. Table 3 shows
that the response to IT’s approach to issues can vary strongly with between functional
areas (red indicates
significant levels).
Table
3
INFORMATION
TECHNOLOGY PROFILE
DIFFERENCE WITH OTHER SELECTED FUNCTIONS*
(IT Sample Size = 147; Academic significance
- 95% or higher)

Table 3 cites
the probable relationship of IT with specific areas where our sample size was
large enough to be statistically meaningful
(see sample size on extreme right of Table 3). The block of numbers on the right shows the percent variation
in strength of commitment to a style between IT and non-IT executives. The
block on the left is the chance that this strength variation is structural (i.e. statistically significant) rather than just noise generated by
the measurement system.
The
percentages in red are those that meet the test
of statistical significance (i.e., 95% or better
chance that the variation is not random).
A positive strength number (in the right block) indicates IT is higher in strength on
that dimension. A negative indicates that the non-IT function cited is more
committed to that strategy. Table 3 shows that IT’s exposure is likely to be
localized by function. The importance of any exposure depends on the interests
of the parent organization. For example, IT’s malalignment with legal could be
inconsequential in a firm with few legal exposures. It could be vital in a
heavily regulated industry. There is no universally specific point of exposure.
The “take
home” from the above analysis is that IT is well positioned at the level of
overall policy. IT commands about as much respect and deference as do other
functions. In fact, it is in a somewhat preferred position. The innovative
posture it stresses is generally highly valued. Little needs to be done to
improve IT’s overall organizational standing.
Specific
areas like finance, legal and engineering (in
our sample) can “trip up”
IT’s generally favorable position. A larger sample may well identify more such
points of exposure. The importance of these “disconnects” depends on the
specific industry and a firm’s targeted mission within its operational context.
Identifying and addressing these specific areas of exposure offers IT the best
opportunity for a high return on its organizational investment.
A viable
strategy for addressing organizational issues is to first identify the points
of contention. This should not be difficult. Positions tend to be subtle at
high levels but senior executive sensitivities are typically attuned to pick up
nuances. Executive judgements can probably be trusted.
The second
step is to identify the “root cause.” The first impulse is to blame the
condition on the function involved. For example, finance is stingy and
nit-picky. Or engineering is too focused
on intellectual improbabilities. These observations may be true. But they are
of little operational value. A more productive strategy is to focus on the
information strategies needed by these other functions to do their job. Disconnects
between these strategies and those favored by IT are the likely points of
tension.
The third
step is for IT to design strategies that specifically address the points of
tension; different ones for different functions. Strategies that work in Human
Resources are unlikely to be optimal for Engineering. Adjustments need not be
major initiatives. For example, merely tempering a proposed innovation with an
acknowledgment of risks can lessen the concerns of a function whose interests’
center on full understanding before acting (e.g.,
engineering).
The most
appropriate remedial strategies will depend on the area affected. In general IT’s
strategy will involve acknowledging the legitimacy of interests involved. Then
reframing (not necessarily changing) the position of contention in a way that mitigates (not necessarily eliminates) some portion of the concern.
A
remedial strategy can be developed by trial and error. Simply understanding the
concept of root cause as applied here is a step forward. Detailed knowledge
provided by an “I Opt” assessment can help provide definitive guidance. The
last observation is self-serving but nonetheless valid. An accurate assessment
of both direction and magnitude of commitment benefits all involved.
IT REPORTING RELATIONSHIPS
Leader-follower reporting relationships reflect themselves in the ability of IT to realize its full potential. A portion of this condition is registered by level of reporting relationship satisfaction. In general, a positive level of IT satisfaction probably bespeaks of an ability of IT to do its job in something approaching an optimal manner. Everybody is on the same page.
Deloitte Consulting recently addressed
this issue (see
footnote #2 for citation).
Deloitte surveyed 1,271 CIO’s domiciled in 43 countries. The survey captured
both IT reporting relationships and the satisfaction being enjoyed by the IT
executive. The results are shown in the first two columns of Table 4.
Table
4
INFORMATION
TECHNOLOGY REPORTING RELATIONSHIPS

A
majority of IT executives in Deloitte’s sample reported to either the CEO (33%)
or CFO (22%). The difference in satisfaction levels is striking—89% found
working for a CEO to be satisfying in contrast to 18% working for the CFO. The
COO and Business Unit Manager fall about in the middle. The ~30% satisfaction
level is higher than CFO and lower than with the CEO. The question of
satisfaction level appears to be settled by the Deloitte study; the question of
“why?” is unaddressed.
One difference in the reporting levels is that, with the exception of the CEO, each is focused on a different aspect of that enterprise. This focus requires that each role have a sensitivity to different variables (i.e., input) and favor a particular character of response (i.e., output). Connecting these different input-output particulars requires a somewhat different logic or reasoning (i.e., process). There can be little doubt but that these information processing differences can affect the nature of a relationship.
Any divergence between the information processing favored by the IT executive and that of their reporting principal can be a basis for dissatisfaction. That difference can be local to one style (e.g., level of analysis) or cumulatively spread across all four styles.
The direction
of the difference does not matter. Too much stress on a particular posture can
be as damaging as too little. Therefore in measuring divergence we want avoid methods
that “net out” differences (like averages). What is needed is an index that
treats any kind of divergence equally.
Table 4 provides
that kind of index in column 3. It is titled “Information Processing Variation.”
It registers the absolute magnitude of differences between the IT executive and
the various leaders to whom they might report. In other words the sign is
ignored. A 5% positive difference in one style and a 5% negative in another
style is treated as a 10% difference.
A rough
correlation between the leader and IT executive is obvious. The direction of
the correlation is fairly certain. The higher is the divergence in information
processing; the lower is the satisfaction of the IT executive.
The data also
suggests that the degree by which satisfaction falls with the rise in
information divergence is large. The CEO/IT satisfaction level is 4 to 5 times
higher than the CFO/IT. The degree of divergence is also about 4 to 5 times
higher (CEO 3%, CFO 18%). A similar but not identical result
obtains when comparing the CFO to the COO. The COO/IT satisfaction is about 2
times higher than the CFO/IT (COO 34%, CFO 18%). The divergence in information
processing is also about 2 times (COO
7%, CFO 14%).
The
temptation is to say that every 1% increase in information processing
divergence yields a 1% decline in satisfaction. However, that kind of certainty
would be misplaced. IOPT measures information processing on a ratio scale (i.e., like a ruler).
Deloitte’s satisfaction is measured on a nominal scale (i.e., like a light switch—satisfied/unsatisfied). We do not know what the CIO’s
standard of satisfaction was or if it is consistent across the 1,271 CIO
respondents. The size of the differences makes the direction of the
relationship fairly certain. But the arithmetic consistency can only be
accepted as suggestive rather than definitive.
SPECIFIC
AREAS OF TENSION
“I Opt”
technology is not confined to identifying overall levels of commonality and
potential tension. It also has the capacity to identify specific areas where
tension is likely to arise.
One of the simplest ways is through a measure is akin to the Mode in descriptive statistics. The Largest Single Variation column (column 4) in Table 4 applies this measure to the current research. This is the single area (among 4 possible) where the divergence on issue assessment is most likely to be encountered. This is a crude tool. However, it has the merit of quickly characterizing the differences in an easily understandable manner.
One of the simplest ways is through a measure is akin to the Mode in descriptive statistics. The Largest Single Variation column (column 4) in Table 4 applies this measure to the current research. This is the single area (among 4 possible) where the divergence on issue assessment is most likely to be encountered. This is a crude tool. However, it has the merit of quickly characterizing the differences in an easily understandable manner.
There are
some risks. One is that Largest Single Variation may be irrelevant to both IT
and the responsible executive. Another is that there may be another style
difference just a bit lower in strength but of more relevance. These situations
will arise but probably not with great frequency.
The utility of the Largest Single Variation (i.e., Mode) is that this is the area most likely to be the source of difficulty between the functional head and the IT executive. Addressing this single area is likely to yield the highest return on investment for any relationship improvement efforts.
The utility of the Largest Single Variation (i.e., Mode) is that this is the area most likely to be the source of difficulty between the functional head and the IT executive. Addressing this single area is likely to yield the highest return on investment for any relationship improvement efforts.
The Largest
Single Variation offers a clue on where to begin looking for the root cause.
However, an examination of the CFO/IT executive relationship clearly shows its
limits. The 18% Largest Single Variation in the fast acting RS style is highest
single variation registered in this relationship. Spontaneous opportunistic
actions by the IT executive will be a point of contention. However, such
actions may not be all that frequent. Positions based on other styles in the IT
executive’s repertoire also matter.
In
the case of the CFO/IT executive relationship the differences in all four
information processing styles register statistical significance. Graphic 3
indicates that something is going on that arises from the inherent structure of
the two areas (i.e., finance versus IT).
Graphic
3
CFO vs. IT EXECUTIVE
INFORMATION PROCESSING COMPARISON

The blue
shaded areas of Graphic 3 in LP (structured action) and HA
(structured thought) shows
the CFO substantially exceeding the IT executive across all higher levels of
commitment. It is quite likely that IT will fall short of the CFO’s standards
in these areas. Initial IT proposals are likely to be seen as inadequate in
both the intellectual justification (HA) and operational specificity (LP). It
is unlikely that the CFO’s guidance along these lines will be favorably received
by the IT executive.
The situation
is reversed on the RS (opportunistic
action) and RI (creative options)
dimensions. Here IT executives exceed the CFO across all higher commitment
levels. And this is not a formula for organizational happiness. Spontaneous RS
actions are likely to be seen as irresponsible. Innovative proposals will
probably be challenged (not necessarily
rejected) on the grounds
of risk. Neither of these responses are likely to be well-received by the IT
executive.
It is no
surprise that the CFO and IT executive satisfaction level registers a rock
bottom 18%. The style strength distribution (the red and blue shaded areas) is appropriate to the main mission of
each function. There is nothing wrong with the elected styles of either party.
The problem is that the mission requirements of the two functions seriously
diverge in terms of the kind of information processing needed to do the job.
The central
characteristic of the CFO function is protection and risk avoidance. Mistakes
carry potentially catastrophic legal and financial consequences. We want our
CFO’s to be rigorously conservative in their approach to decision issues. For
example, having to restate past earnings due to a classification judgement can
affect the wealth of all shareholders—a situation likely to reverberate
throughout the organizational structure, including that occupied by the IT
function.
A
central characteristic of IT is efficiency and opportunity. Mistakes are
typically tolerable. They seldom threaten the existence of the organization.
Risk has less consequence. Under these conditions an experimental posture which
tolerates risk is appropriate. For example, Google News was initially just
programmer’s diversion but evolved into a central feature of the Google search
engine. Had that initiative been run by a CFO it is likely that its value would
have been challenged with consequent delays and potentially dismissal.
The
root cause of the structural tensions is not an irrational condition. The two
executives in the relationship spend a majority of their time addressing issues
within their main function. The general decision algorithms embedded in their
minds from doing their primary function will tend to be applied on decision
issues that require joint action. This is what is playing out in the CIO’s low 18%
satisfaction level.
CONCLUSION
Matching
information processing profiles generally benefits all concerned, including the
organization as a whole. Irrelevant points of tension are minimized. Decisions
focus on appropriate variables. The satisfaction of all involved helps insure
organizational commitment.
However,
there are many other reporting structure considerations beyond information
processing alignments. Time available, subject matter expertise, proximity,
interest and workload are just a few. The Deloitte descriptive study and the
evidence-based research offered by “I Opt” technology provide useful insights to
help decision makers gauge the areas and degrees of exposure flowing from
organizational relationship decisions and processes. It is usually a good thing.
BIBILIOGRAPHY
1. “I OPT” VALIDATION: “I OPT” technology has been extensively
validated both in terms of theory and operation. The major publications on the subject
include:
a) A book has been published which covers
all eight accepted tests of validity is available from Professional
Communications at a modest cost. The book is available free of charge at the
Organizational Engineering website at: http://www.oeinstitute.org/articles/validity-study.html.
An included resume outlines the extensive professional qualifications of the
author.
Soltysik Robert (2000), Validation of Organizational Engineering: Instrumentation and Methodology, Amherst: HRD Press.
A doctoral dissertation titled A Study of Intuition in Decision-Making using Organizational Engineering Methodology was approved by Nova Southeastern University in 2000. The dissertation used “I Opt” as both a subject and research instrument. The dissertation was subject to review by an independent doctoral research committee headed by a Ph.D. focused on research methods and found to meet all academically accepted standards of validity. The complete dissertation is available free of charge at http://www.oeinstitute.org/articles/ashley-fields.html.
The dissertation is also available in book form as: Fields, Ashley (2001). The Effects of Intuition in Decision-Making, ISBN-13: 978-3639368185, Germany: VDM Verlag Dr. Müller (August 18, 2011). Available from Amazon.com.
b)
“I Opt” Style Reliability Stress Test: A sample of 171 surveys applied a
classic test-retest design covering a period of 18 years to test the
reliability of the “I Opt” instrument on styles (i.e., short term decision responses). The results far exceed the
reliability of traditional instruments (i.e., MBTI, DiSC, Firo-B, 16PF). The research is available of the
Google research blog in textual form at: http://garysalton.blogspot.com/2011/03/i-opt-style-reliability-stress-test.html.
A 10-minute video of the study is available on YouTube at: https://www.youtube.com/watch?v=Vs6eoIsqVkc
A 10-minute video of the study is available on YouTube at: https://www.youtube.com/watch?v=Vs6eoIsqVkc
c)
“I Opt” Pattern Reliability Stress
Test: The same data
as used for style reliability was applied to patterns (i.e., long-term
decision sequences). The
change between test-retest was found to be negligible. The research is
available of the Google research blog in textual form at: http://garysalton.blogspot.com/2011/03/i-opt-pattern-reliability-stress-test.html.
A 15-minute video of the study is available on YouTube at:
https://www.youtube.com/watch?v=0SLg28BhNHU
A 15-minute video of the study is available on YouTube at:
https://www.youtube.com/watch?v=0SLg28BhNHU
d)
Operationally “I Opt” has been validated through
continued worldwide use at all levels from hourly workforces to Board of
Director levels of Fortune 50 organizations in the profit, non-profit and
government sectors. An outdated (last updates 15 years ago) listing of the organizations involved
can be found at http://www.iopt.com/corporate-information.html. Many of the clients cited have continued to
use the technology for decades and many more pages of new clients could be
added if the list were to be updated to today.
2. Kark,Khalid; White, Mark;
Briggs, Bill (2015); 2015 Global CIO
Survey. Deloitte University Press, Westlake, Texas. Accessed on the internet December 20, 2016 at
https://www2.deloitte.com/content/dam/Deloitte/at/Documents/technology-media-telecommunications/cio-survey2015.pdf